Updated: 26 May 15
Abstract
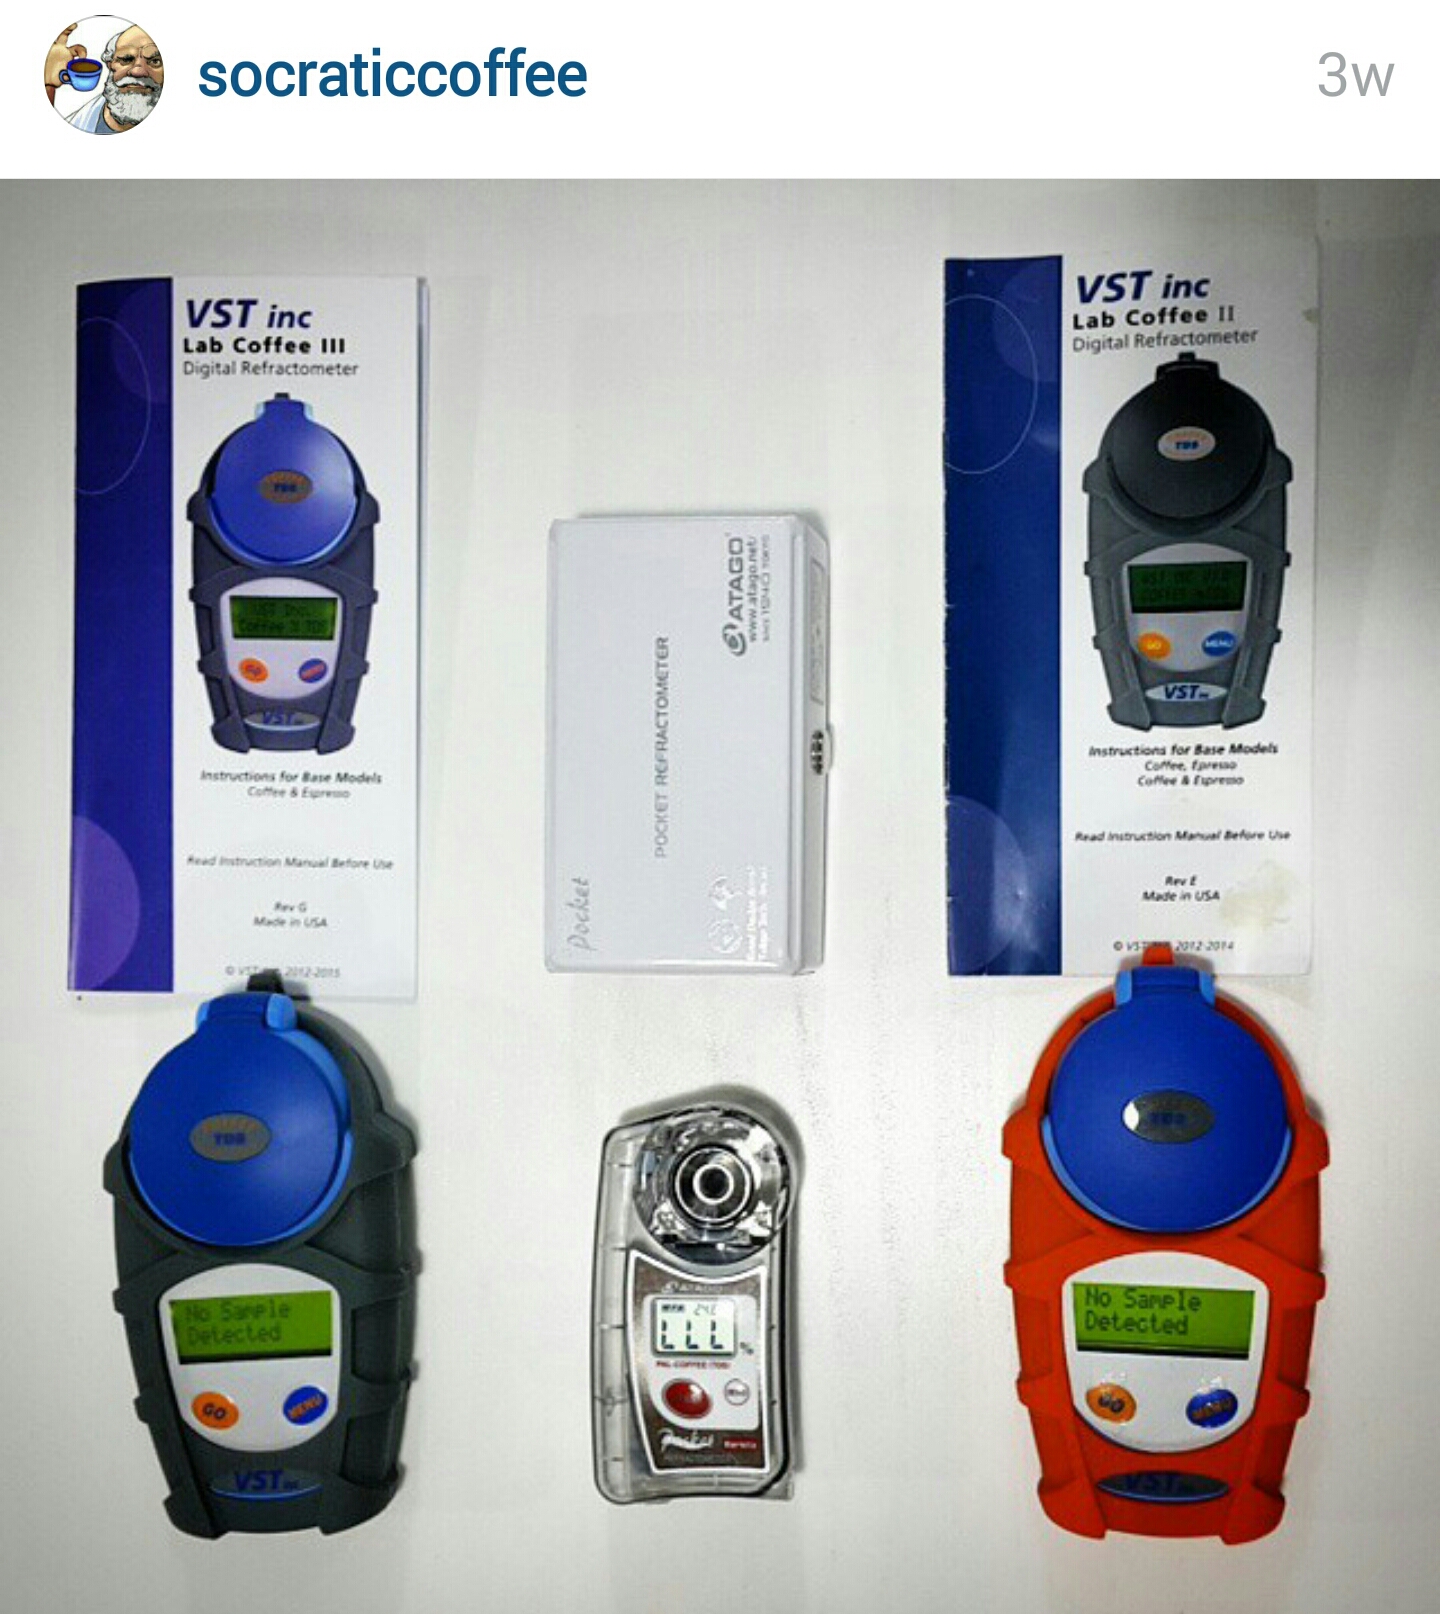
Continuing from our previous post on refractometer comparisons, the goal of this study was to examine the measurements from three refractometers advertised to measure the total dissolved solids (TDS) content of coffee. In three separate experiments, the VST LAB Coffee II Coffee & Espresso Refractometer, VST LAB Coffee III Refractometer, and Atago PAL-COFFEE Refractometer were compared with 10 samples for each device. Testing procedures followed the VST recommended guidelines. In two of the three brew tests, there was no significant difference between the VST LAB Coffee III and the Atago PAL-COFFEE. For all three brews, there was a significant difference with the VST LAB Coffee II refractometer and the other devices (p = 0.00 for all comparisons).
Disclosures
We have no vested interest in any of the products being tested.
Authors
Jeremy and Joe
Introduction
Coffee is most often thought of as a solution, consisting of a solvent (water) and solutes. As described in much greater detail by others (e.g., Flament 2002; Andueza et al. 2003), over 600 potential flavor-impacting compounds have been identified in the seed. While not all compounds contained within the roasted beans are soluble, the resulting complex beverage that is brewed is considered by many a homogenous mixture composed of a single phase with particles that cannot be seen by the naked eye, thus making its soluble content quantifiable through standard means of solution concentration measurement such as refractive index.
In simplistic terms, the index of refraction describes how light passes through a medium. The angle of refraction as light passes through the coffee (i.e., how the light bends when passed through the solution) is often captured by a photodetector and the resultant refractive index calculated. This is a method typically used to assess the concentration of a solute in an aqueous solution, most often called the total dissolved solids (TDS) percentage (for more in-depth explanation on refractive index and its application to coffee, see Clarke 1989).
At least two consumer-grade refractometer product lines have been marketed specifically for coffee solute concentration assessment: a series marketed by VST and a series produced by Atago. Both have offered several models. Early iterations of what would become the VST refractometer were produced by Atago, who has been developing refractometer technology for over 70 years. VST then switched to Reichert Techologies refractometer hardware (Reichert has a 150-year history of producing optical measurement equipment), originally called the R2 mini but now sold as the Brix/RI Chek. The current models tested here are based on the hardware of the Misco Palm Abbe. VST branded equipment has custom-loaded software on its refractometer units to provide a TDS of coffee/espresso directly without the need for correlation tables. Atago has been marketing their own coffee-specific refractometer calibrated with an “industry scale” specifically for coffee, providing a direct readout of either Brix (a scale based simply on the refractive index of sucrose in an aqueous solution) or correlated TDS reading. For anything other than sucrose, the Brix scale only provides an approximate dissolved solid content reading.
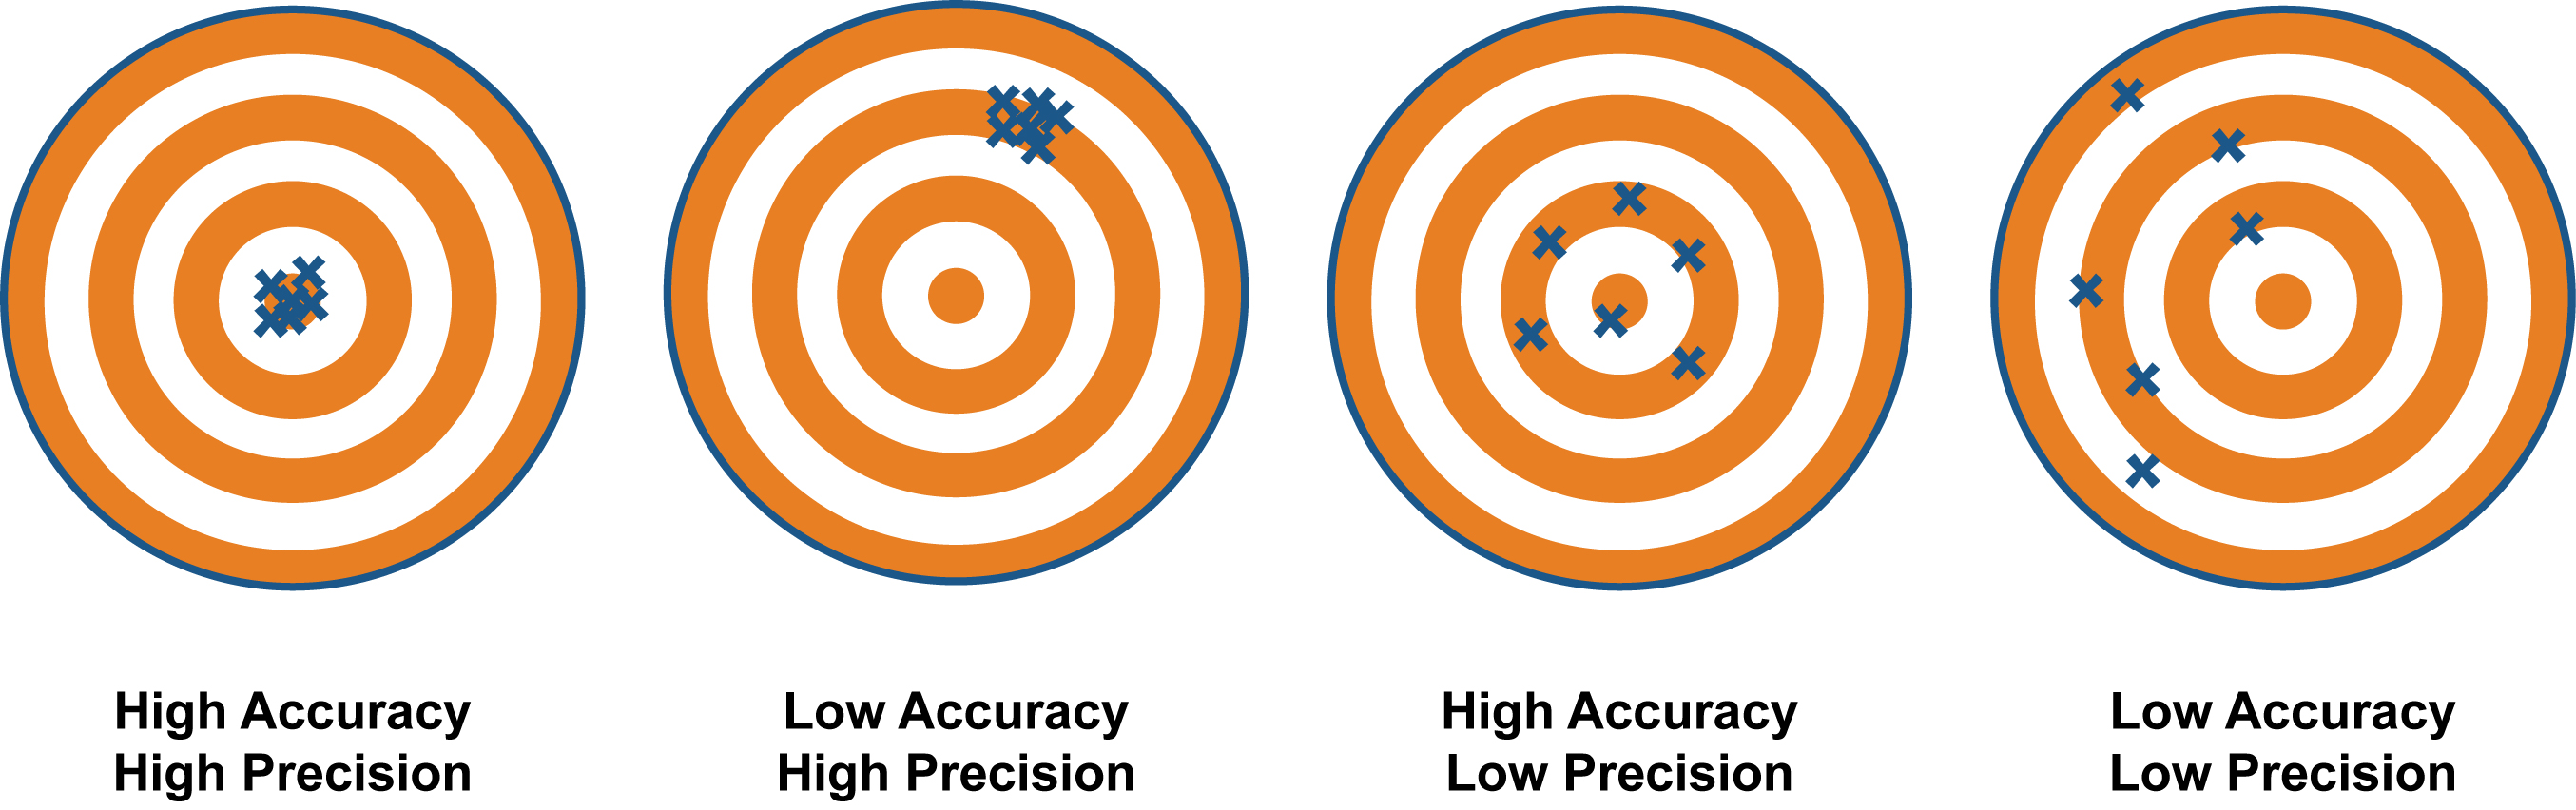
We set out to test the performance of three devices compared against each other, not assess their individual precision or accuracy against stated manufacturer specifications. To test precision and accuracy within a device would require us to compare against another metric of TDS quantification and a known reference solution. This is an important point to make and is illustrated in the figure below:
Methods
The VST devices used were the VST LAB Coffee III 4th Generation Refractometer (stated range: 0.00-20.00% TDS; TDS resolution 0.01%; precision +/-0.01%; accuracy from 0.00-4.99% of +/- 0.03% and from 5.00-20.00% of +/-0.05%; temperature range of 15-40C) and the LAB Coffee II (Coffee & Espresso) Refractometer (stated range: 0.00-20.00% TDS; TDS resolution 0.01%; precision +/- 0.03%; accuracy from 0.00-4.99% of +- 0.05% and from 5.00-20.00% of 0.10%; temperature range of 15-40C). The Atago device was the PAL-COFFEE (stated range: 0.00-22.00% TDS; TDS resolution 0.01%; accuracy in Brix of 0.10; temperature range of 10-100C; temperature resolution 0.1C). We recommend checking the companies’ sites for more information regarding device specifications. All refractometers were loaded with fresh batteries and, along with container of distilled water, placed on the test bench the night before to allow temperature to equilibrate to ambient room temperature (25C). Distilled water, using a conductivity-based TDS meter, contained 0 ppm and was used to zero all devices.
The coffee used for the experiment was Campos Pulped Natural “Ouro Verde” roasted for filter coffee.
Equipment used:
- Kalita stainless steel wave dripper
- Kalita filter paper
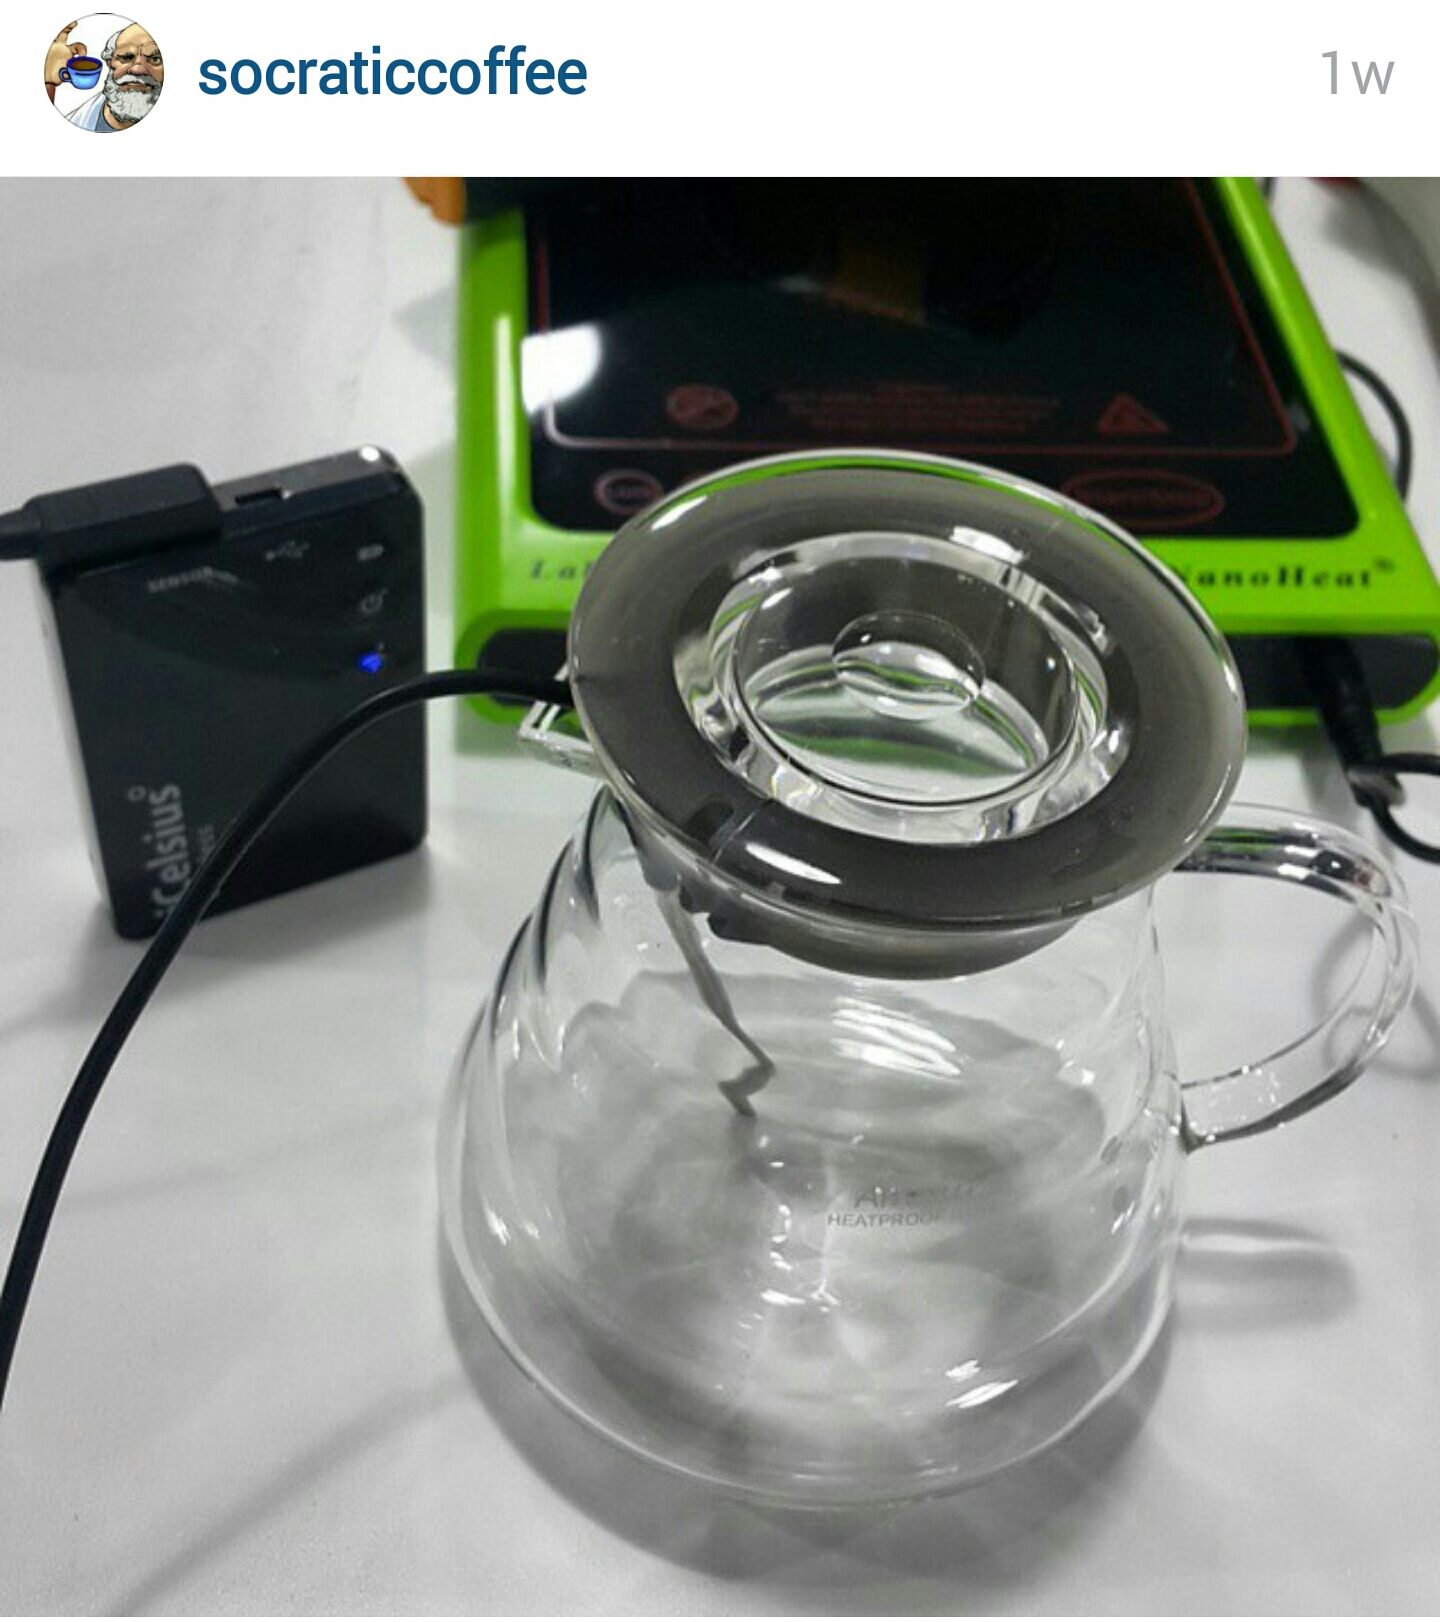
- Kalita carafe & Lid
- Bonavita 1.0 L digital variable gooseneck kettle
- Infrared gun
- FLIR thermal camera
- iCelsius temperature probe
- AWS scale
- Ohaus Scale
- EK-43 Coffee Grinder
- Atago refractometer
- VST LAB II refractometer
- VST LAB III refractometer
- Pipettes
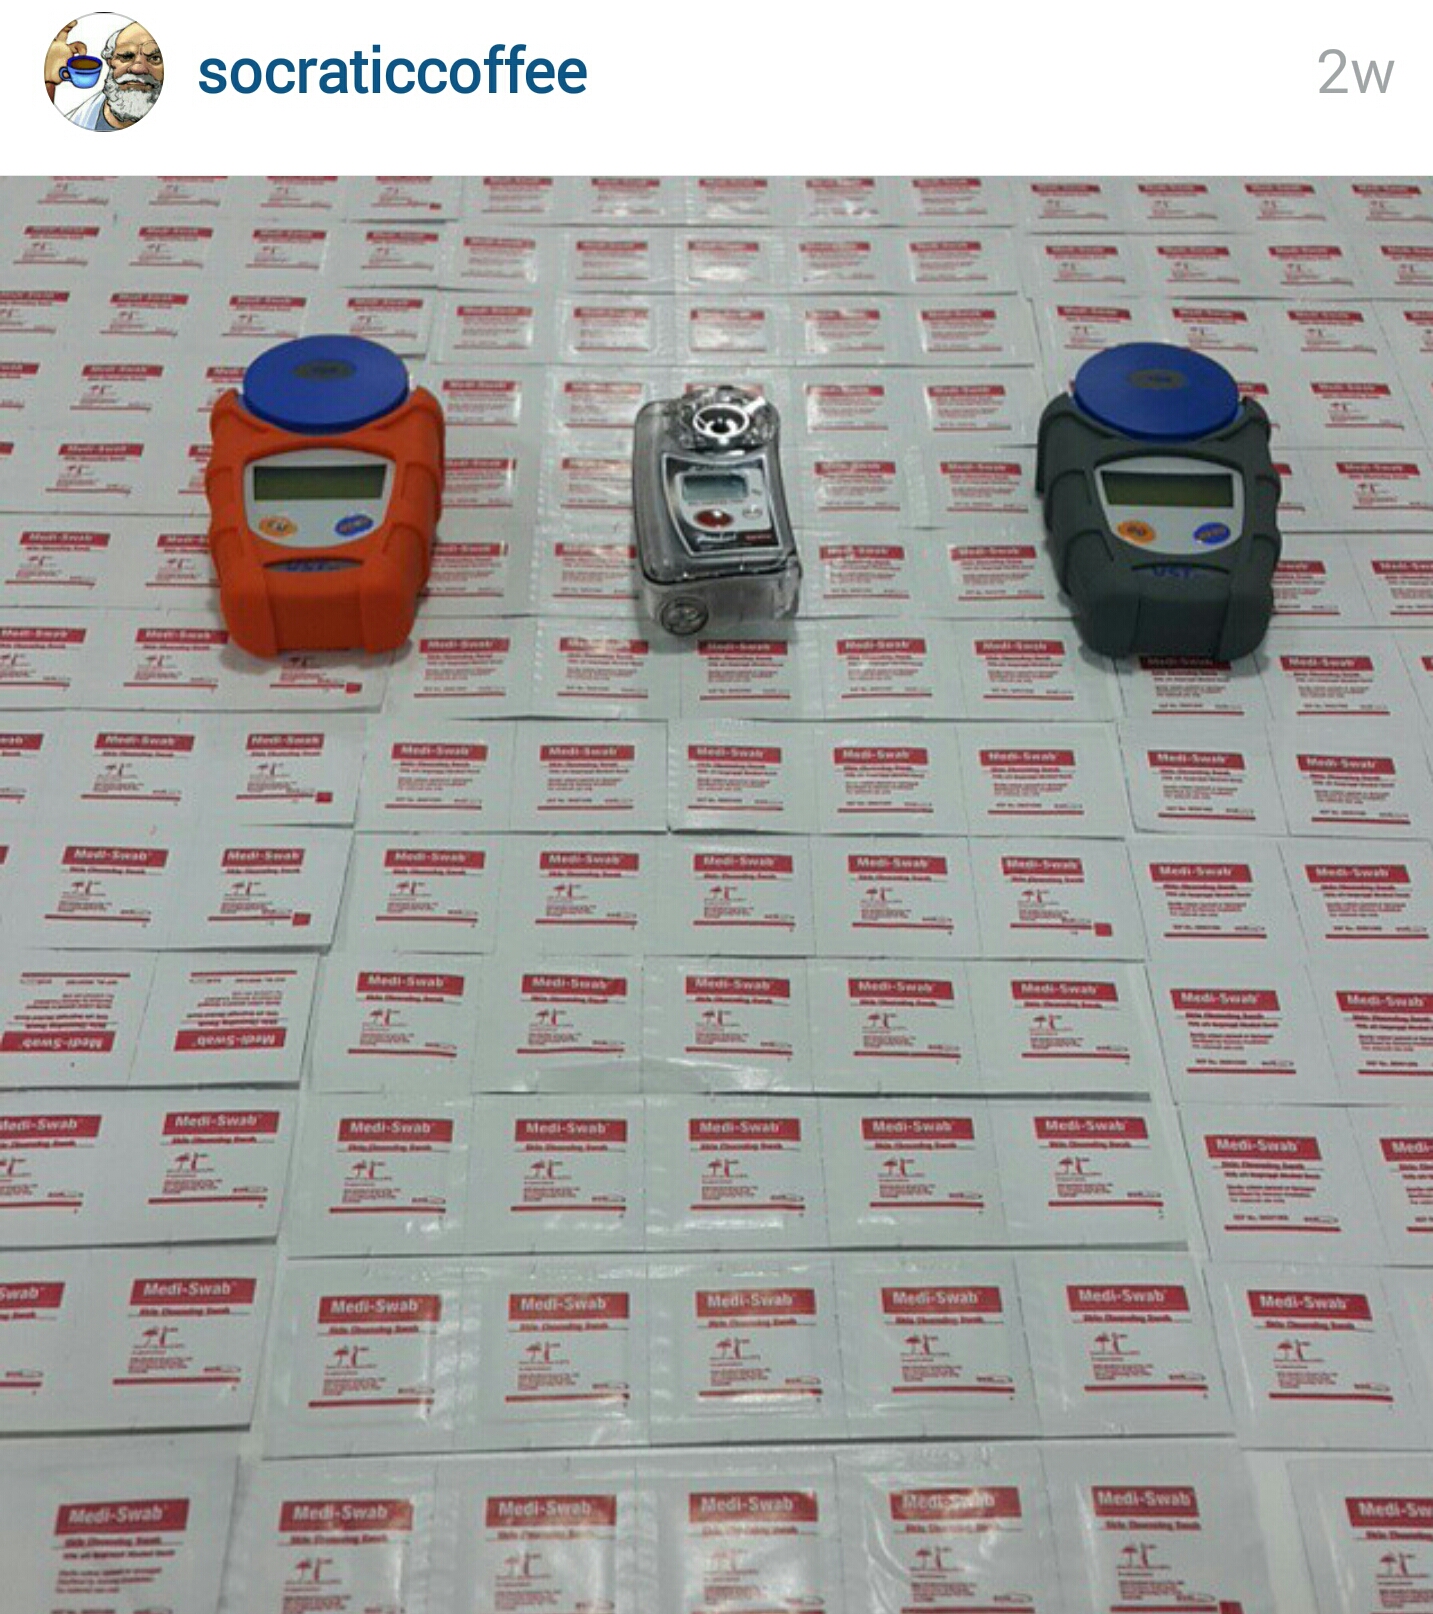
- Alcohol wipes
- Ceramic cups
- Tissues
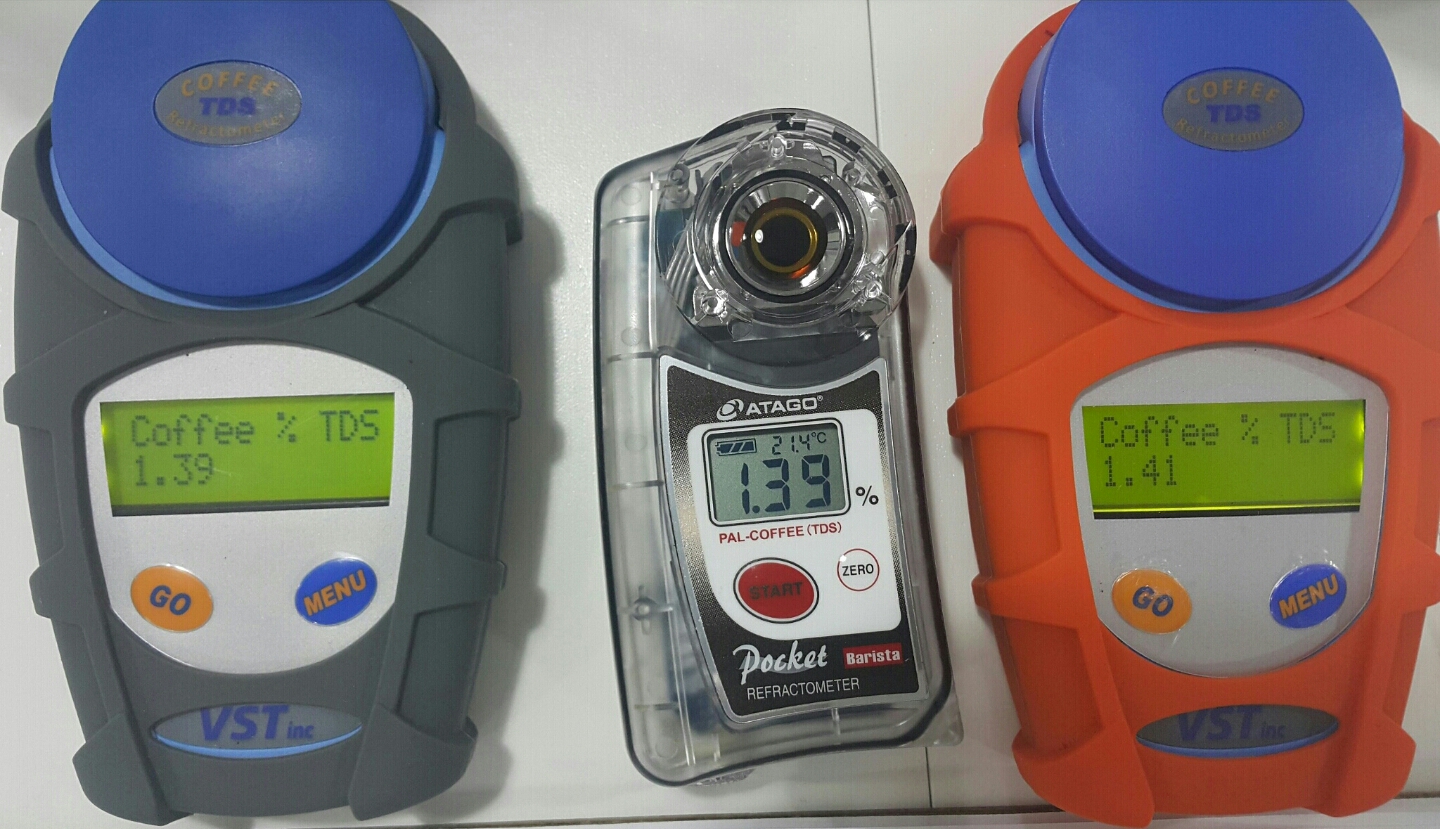
Pour over coffee was brewed at 94 degrees Celsius at a ratio of 1g coffee to 17g water. The brew was 15g of coffee to 255g of water, with a total time of 2 minutes and 45 seconds. No stirring or agitation was applied during the brew. Immediately after brewing, the carafe was covered with a fitted lid and allowed to cool to the recommended temperature of 30C. For all three brews, sample temperature at the start of the readings ranged from 28-25C. The syringe was rinsed with the brew before taking each sample. After swirling the coffee in the vessel, a sample of 6-8ml was siphoned from the syringe and placed into a ceramic cup to rest for 30 seconds. Again, after swirling the sample in the cup, a pipette, which was also rinsed with the brew, was then used to transfer the sample and debit it onto the wells for each refractometer. After 30 seconds in the wells, a sample value was recorded for each device. A new, unused alcohol pad was opened to clean each device after each sample (90 total alcohol pads).
Results
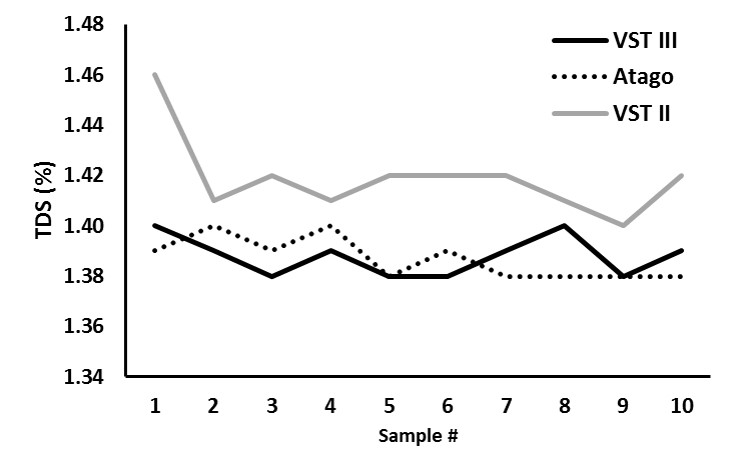
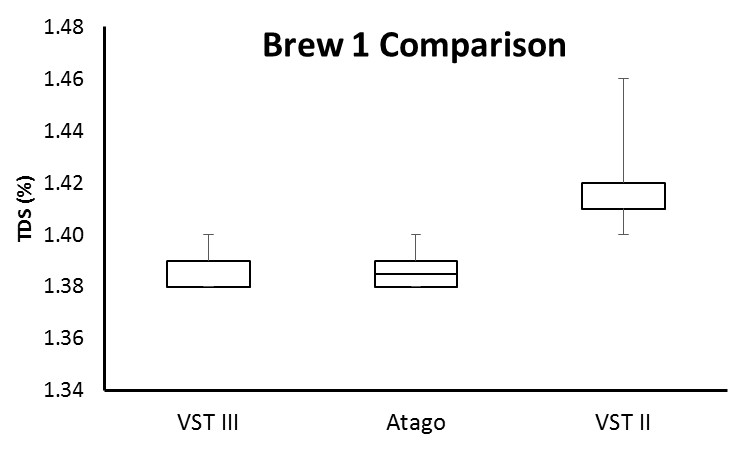
Brew #1
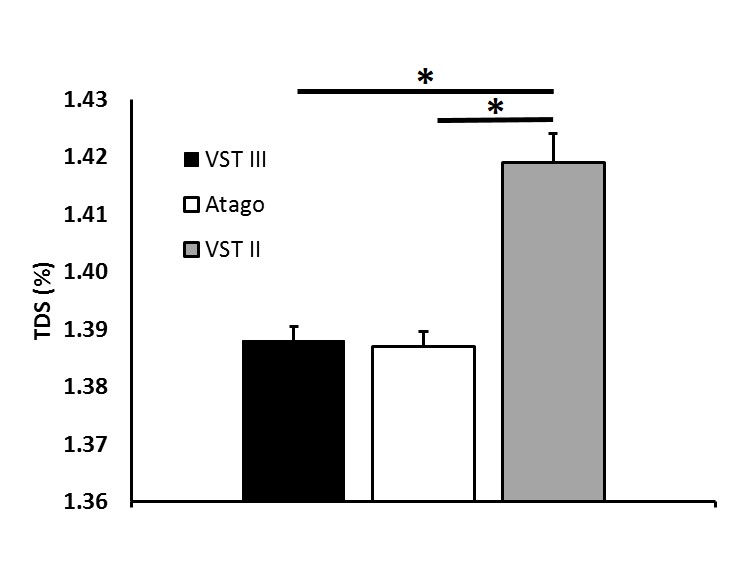
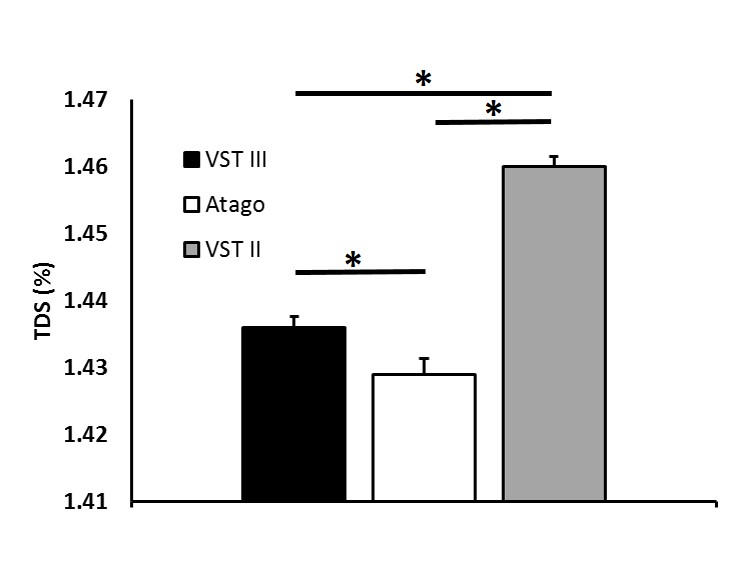
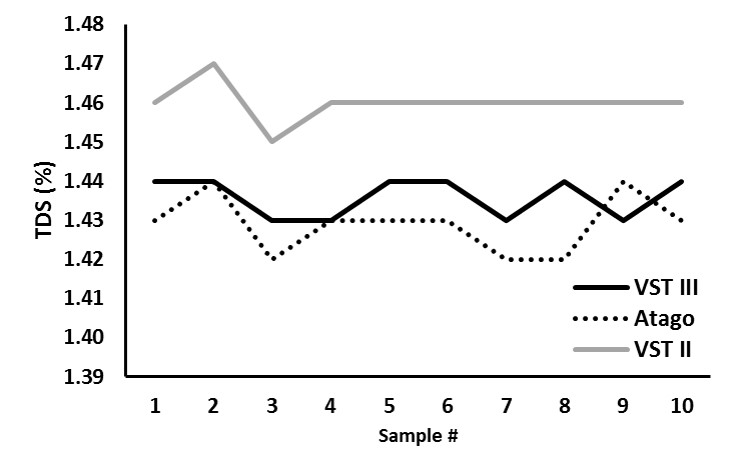
An analysis of variance (ANOVA) demonstrated a significant difference between device type, F(2,27) = 25.83, p = 0.00. Post hoc analysis revealed a significant difference between the VST II and VST III (p = 0.00) and VST II and Atago (p = 0.00) but not the VST III and Atago (p = 0.78).
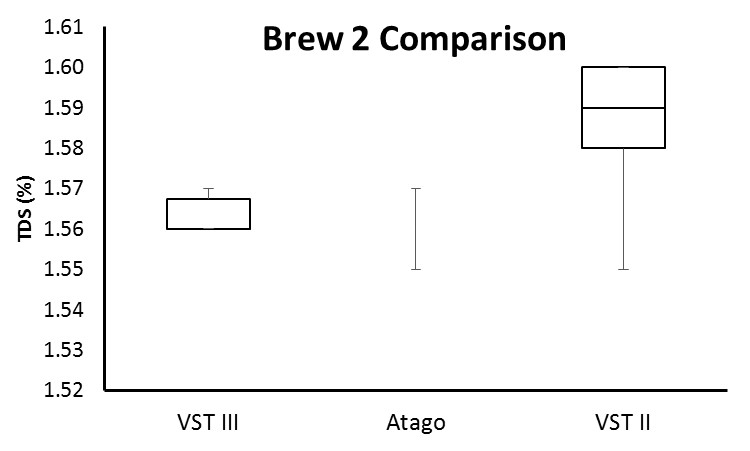
Brew #2
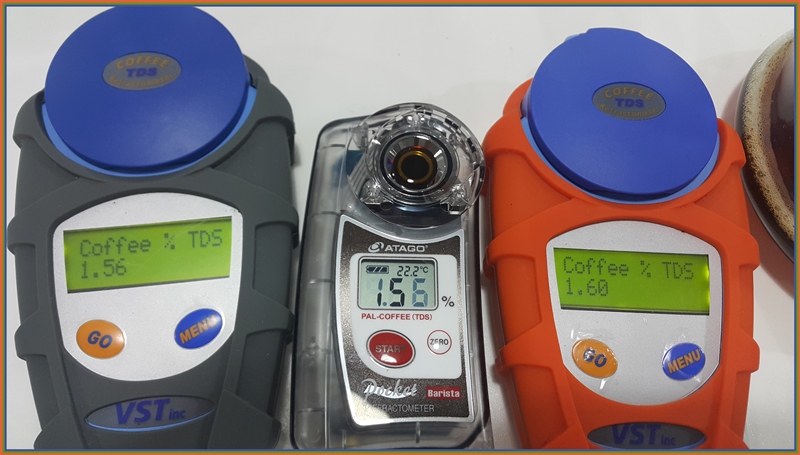
An ANOVA demonstrated a significant difference between device type, F(2,27) = 11.99, p = 0.00. Post hoc analysis revealed a significant difference between the VST II and VST III (p = 0.00) and VST II and Atago (p = 0.00) but not the VST III and Atago (p = 0.78).
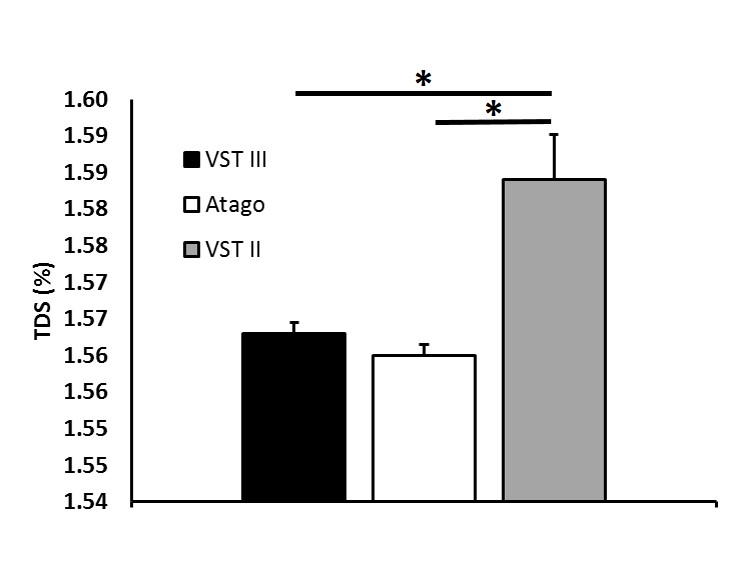
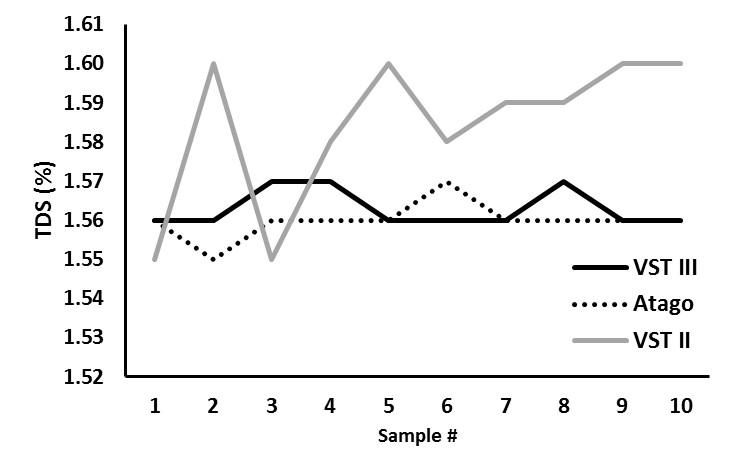
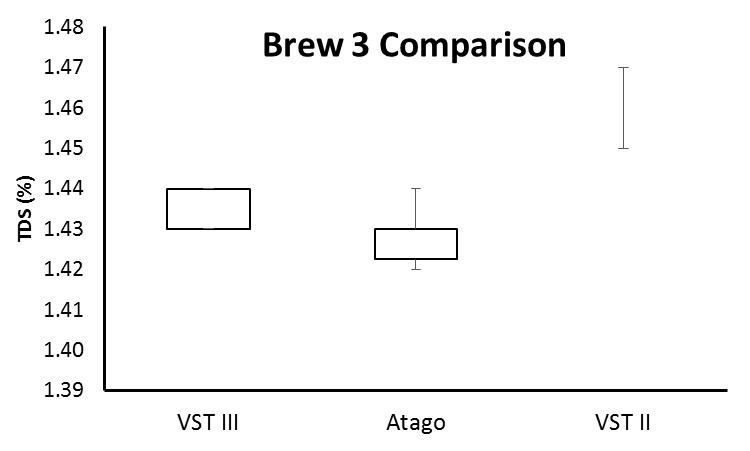
Brew #3
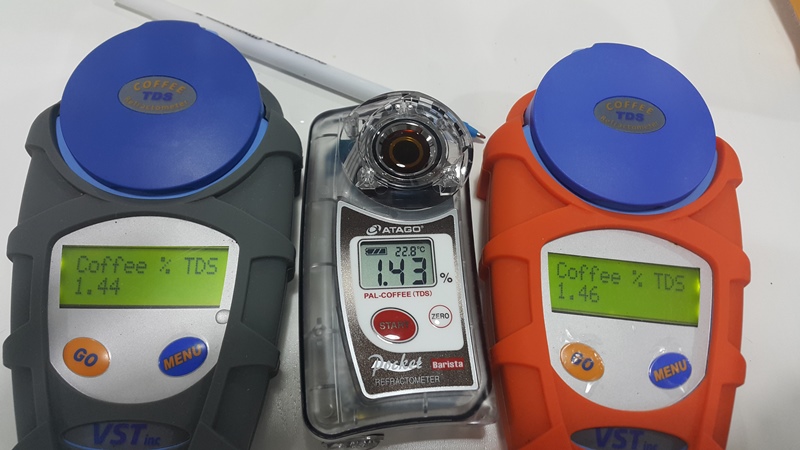
An ANOVA demonstrated a significant difference between device type, F(2,27) = 76.74, p = 0.00. Post hoc analysis revealed a significant difference between the VST II and VST III (p = 0.00), VST II and Atago (p = 0.00), and the VST III and Atago (p = 0.02).
(Raw data can be downloaded in a tab delimited text file here. As always, while we offer the data for your personal use, we kindly ask that you send a message to socraticcoffee@gmail.com before posting or presenting it in any public forum and attach appropriate acknowledgement.)
Conclusions
Overall, the VST III and Atago devices performed comparably, both demonstrating significantly less variability compared to the VST II. While a statistically significant difference was seen in the third brew between the VST III and Atago, the average difference in TDS measurement for that brew was 0.007. We leave it up to the reader to determine whether or not a statistically significant difference is meaningful in his/her application of refractometry (and whether or not it falls within the devices’ stated measurement capabilities and tolerances).
As stated in the introduction section, we did not set out to verify the accuracy and/or precision of the individual devices compared to their manufacturer stated specifications. To reference the earlier picture of accuracy and precision in a target practice setting, we do not know the location of the “bullseye”. Any of the three devices could be the most accurate. Some sense of device-specific precision may be perceived through standard deviation and is perhaps best illustrated in the box-and-whisker plots (i.e., the spread of the plot for a device); however, our purpose and methodology were not to assess device-specific precision, so we have no analysis regarding that aspect of the data. We did not assess if the measurements cluster in the correct area (because we do not know where the correct area is–accuracy), instead we assessed if the clustering of measurements from each device was different from the others, which is influenced by the tightness of the clustering within a device as well as the separation of the clustering between devices.
References
Flament I. (2002). Coffee Flavor Chemistry. West Sussex, England: John Wiley & Sons, Ltd.
Andueza S., Maeztu L., Pascual L., Ibanez C., Paz de Pena M., Cid, C. (2003). Influence of extraction temperature on the final quality of espresso coffee. Journal of the Science of Food and Agriculture, 83, 240-248.
Clarke R.J. (1989). Water and Mineral Contents. In R.J. Clarke & R. Macrae (Eds.), Coffee: Chemistry (Volume 1) (pp. 42-82). New York, NY: Elsevier Science Publishers LTD.
Devin Lee
How about on spro test? Atago shows stable accuracy and precision data?
Joe
Hi Devin,
Thanks for your message. Please note that we have not tested it yet with Espresso, it is something we can do in the near future.In having said that it’s harder for brewed coffee as it requires finer resolution of the instrument compared to espresso
Thanks
Mark
Do you have the sampling order for each brew & refractometer measurement, was it randomised/rotated to ensure that any effect of stratification was mitigated due to the long cooling period?
Joe
Hi Mark,
Thanks for your message. Please note that all readings were carried out consistently in this order: VST LAB III, ATAGO, VST LAB II
Mark
Hi Joe, Thanks for you response. Given the long cooling time (what, about an hour?) how can you be sure that there was no settling/stratification of the samples being tested? If just 3 brews were made, why not 1 sample (per brew) per refractometer & 10 pushes of the read button? The precision of the instrument surely can only be determined if we have confidence that the samples are consistent and do not deviate by a larger order than the precision tolerance. It seems odd that the widest tolerance follows the instrument that was tested last in 2 of the examples. Rotating/randomising the order of testing would given a more level playing field, given your test protocol. Without confirmation, via another datum, of the consistency of the test samples does this not introduce the possibility of noise?
Jeremy
Hi Mark,
The stratification you mention is a good point — and we always swirl the container before drawing our sample, so I’ve edited the post to reflect that. There’s also the act of siphoning the sample, which could, potentially, further homogenize the particles in the solution a bit. We can also do what you mentioned (i.e., continuous readings of a single sample) at a future date. If we do so, the natural settling and stratification of particulates in the solution will become more of a concern, so we’d have to be creative in coming up with controlled ways to combat that.
The device demonstrating the greatest variability has done so in multiple experiments (cf., our first post comparing the VST II and Atago), regardless of the order in which it received the sample. From a scientific methodology perspective, you would be implying a confound due to order effects–this would mean it is explained variability (i.e., dictated by order) rather than random variability (what we would typically refer to as “noise”). Order effects do not require a separate metric to assess against but rather a change in protocol, as you mentioned. Considering the VST II most often read higher than the other two devices, yet it received the last sample each round, your hypothesis would be that in the pipette carrying the sample to the well there is a less-to-more dissolved solid gradient which is dispensed as such. The problem I see is that, based on your hypothesis and the data we present here, the sample seems to break down into the first two-thirds being equivalent and the last third being significantly higher in dissolved solids. Maybe that’s the case. How that stratification would persist and/or rapidly order itself after swirling and drawing into the pipette seems tricky to explain. Applying Occam’s razor, there is another, more simple explanation.
Thanks for your feedback — we look at this as our “peer-review”, allowing us to improve our protocols and, hopefully, put out useful data for others to consider and critique!
Jeremy
suvasin roongruengsiriwat
very good
Mark
Hi Joe,
Given the test is aiming to establish precision, not accuracy, you state twice in the article that with respect to brew 3, there was a significant difference in the precision of the VST II compared to the VST III & Atago. This is does not appear to be so. The difference between the VST II & VST III in test three is equivalent to the difference between VST III & Atago in test 2 where no significance was found. The precision of the VST II falling between the variance of the other 2 devices.
Jeremy
Hi Mark,
We only state “significant difference” if it is shown through the inferential statistics at a p<0.05 level. The first test we run is an analysis of variance, which allows us to determine if there is a statistically significant difference between devices. If so, we then follow that up with post hoc contrasts, comparing specific devices against each other. This is the common approach used in scientific publications and it allows us to remove subjective opinions on whether or not something "looks significant". I would caution making subjective determinations on what is or is not significant based on perception of the data. While, at the same time, when something is significant, I would suggest examining the data a bit to see if the difference is meaningful given your application, stated specifications of the device, etc. To use an analogy in drug research, you would not only want to find statistical significance but also clinical significance.
Thanks again for the feedback. Our goal is to put useful information out there, removing as much subjectivity from it as possible. Sort of like a Consumer Reports of the coffee community :).
Jeremy
Mark
Hi Jeremy,
I’m not sure that your method of statistical analysis is appropriate for this test. As this is a test of precision rather than accuracy, the devices can all perform within specification, yet legitimately generate a different mean value. For instance, if precision is +/-0.03%TDS you could have 10 readings for one device at a mean of 1.431%TDS (9×1.43, 1×1.44), a second device could have a mean of 1.459%TDS (9x 1.46, 1x 1.45). These, in terms of precision, would be excellent results by any hand held refractometer standards, surpassing any of the results that you have obtained in this test for any unit. They would have the same standard deviation. However, F(1,18)=393, p=0.00? I think this is what is behind my curiosity regarding the perceived variations in test 3.
The use of reference solutions would eliminate doubt regarding stratification, after all the test is related to the devices and should have a datum for the liquid samples to ensure consistency?
Kind regards, Mark.
Jeremy
Hi Mark,
I guess we can disagree as to whether or not the method of analysis is appropriate. As we have tried to style this post in the form of a referred journal article, we have also applied the manner of statistical analyses you would do in that setting. The point you make regarding different means and comparable standard deviations reiterates my earlier response regarding statistical significance versus clinical/practical significance. An analysis of the data from your example would allow you to say “there was a significant difference in the TDS readings from these two devices”. That’s it. But that is a valid conclusion.
For our purposes, the story told by the data we collected, with the protocol outlined here, shows a difference in TDS reading based on device that exceeds a commonly accepted “level of chance” (e.g., 0.05 or 1-in-20). What the absolute TDS of the sample may have been is not what we were attempting to assess. What we can say is that given some unknown absolute TDS of coffee, the VST III and Atago yielded results that were “not different” for two out of three tests. The VST II, on the other hand, gave significantly different results from the other two refractometers each time. Which device is “superior”, we cannot say. For instance, maybe the VST II was actually the closest to the absolute TDS measurement in the sample and the VST III and Atago were significantly off. We are doing a relative, not absolute, assessment. To go back to precision, in this instance, one just needs to examine the level of variability with the readings within a device.
I agree with you the test of brew three shows the VST II with a comparably tight variation in measurements. In that test, its precision looks good. The mean of its TDS readings, however, was significantly different from those of the others. Nowhere in this post do we state one device is “better” than any other. This is just how they performed under these conditions. We’re being open and honest about all of our disclosures, methods, data, and analyses. And we encourage others to do the same.
There are infinite iterations of these experiments we could run. I’m just not sure Joe and I are ready to quit our day jobs and become full time coffee refractometer testers yet!
Jeremy
Mark
Hi Jeremy,
The statistical analysis employed requires consistency of readings across the devices to avoid a significant statistical difference. This requires accuracy & precision. In my theoretical example the two devices have the same standard deviation, but show a significant difference. In test 2, the Atago & VST III have a larger standard deviation, but no statistical difference, as a by-product of the method employed. This is not something to agree or disagree on, we just do the math and we see it.
I very much applaud your science based approach & look forward to more tests, as you say, you are being open & honest about your methodology & findings within its context. However, this method of analysis is tangibly flawed with respect to the stated objectives of the testing. You elected to engage in these refractometer tests (no one is forcing you to become the world’s only full time refractometer testers) & I appreciate the obvious time & effort they have taken.
Mark
Jeremy
Mark,
Precision, for our study, can be thought of as between devices and within a device, defined as:
The closeness with which results of replicate analyses of a sample agree. It is a measure of dispersion or scattering around the mean value and usually expressed in terms of standard deviation, standard error or a range (difference between the highest and the lowest result).
This is from the Food and Agriculture Organization of the United Nations (http://www.fao.org/docrep/w7295e/w7295e08.htm). As you’ll see there, they then describe the tests used for statistical significance–the same ones we used here (Fisher’s F-test for overall model significance, Student’s t-test post hoc contrasts). Your concern seems to be over the philosophy of inferential statistics, which would be great to discuss over a cup of coffee, but is not specific to this post–it’s a broader concern of every application of statistical analysis.
Is there a different way we can present the data that might help alleviate your concerns? And is there a statistical test you’d like us to run?
What is/are your conclusion(s) from the data we present here?
Jeremy
Mark
Jeremy,
My concerns are not over the philosophy of the statistical analysis, they are over the assertion that it can be used to determine precision (solely) for the instruments discussed, without any datum for the samples tested. In test 2 a refractometer could have had readings as far apart as minus eight point four four and as high as eleven point five six…as long as the mean was still 1.56%TDS then no difference would have been shown (an impossible scenario, granted, but it illustrates how far outside meangful “precision” figures could go in the context of the analysis).
One of the devices would seem to be out of specification based on your results (we can’t be sure as we have no datum for the sampled liquid). This being the case, why was the unit not tested with reference fluid, or queried with/returned to the manufacturer?
The Atago, whilst being closer in readings to the VST III could seem to have it’s accuracy verified by that fact, whereas we don’t know what accuracy was. Its mean scores are lower than the other two (but still in a meaningful range, in the context of the testing).
I don’t think that there is any way you can present the current data, the discrepancy shown in the charts relating to the VST II’s precision, particularly in test 3, is misleading. At a cursory glance, as many not familiar with the practical use of refractometer may do, VST II appears as the outlier. If this is some kind of consumer research it should be presented in an easy to understand manner. If it is science then it needs to be robust enough to stand up to scrutiny
The only conclusion I can make from this test is that you made some coffee, put some samples in 3 different refractometers and saw some differences…we can only speculate as to why those readings were different.
Re-run the tests with reference solutions & an equal number of devices from both manufacturers (now that you are aware you potentially have an issue with one of the units, get it checked out).
Jeremy
Mark,
I think that’s where you are misinterpreting what we did — there is no assertion on our part about the individual precision of the instruments given our results. That would be an absolute comparison whereas we did a relative comparison. I guess we could look at the data and compare to device specifications, but that’s not our interest. We did not set out to test their individual precision against manufacturer stated limits but rather against each other. There are more appropriate ways to perform that testing within a device (e.g., as you stated, using known reference fluids). What we can say, and do, is that given the same sample, one of the three devices performed differently each time (and all three performed differently one time). Given multiple samples, some varied more than others. You’re right, in this series of experiments, the VST II is the outlier. Whether or not that difference is “important” is up to you. Our posts give potential customers objective data with the methodology and analysis out in the open. Good for them if they use it to inform themselves when making a purchasing decision. If you know of other device comparisons that are equally as open and controlled (or more so), please let us know and we will link to them. The more information a consumer has, the better. Our data is valid in its constraints/caveats. Maybe we had a device that is out of specification. Or maybe one of the devices is much better than people would like to give it credit. Maybe all of the special enhancements people have bought into don’t have as large of an impact as they might hope. I don’t know. But here’s how an Atago PAL-Coffee refractometer, VST LAB Coffee II refractometer, and VST LAB Coffee III refractometer performed when testing the same coffee.
Jeremy
Mark
Jeremy,
Can you update the Atago instrument’s spec to the same level of detail as the VST? Then consumer’s can make an informed choice as to features.
By the way, 15g x17 isn’t 220g.
Mark.
Jeremy
Hey Mark,
I’ve been thinking about your comments and how we might present the study in a potentially less confusing way. Please look over the revised version of the post and let me know what you think.
Jeremy
Ian
Can you comment on why, in a previous experiment, you found no significant difference between the VST Lab II and the Atago? Thanks!
Jeremy
Hi Ian,
That is most likely due to variability in readings. When the sample is hotter, there is more variability in readings for all devices–and variability in data within a condition (i.e., a single device) decreases the likelihood of finding a statistically significant result (which is based on variability/means differences between conditions/devices). This particular protocol allowed the samples to cool to the temperature range recommended by VST, which reduced variability within a single device and highlighted differences between devices.
Jeremy