Measuring Total Dissolved Solids: A Refractometer Comparison (Part II)
The VST LAB III and Atago PAL-COFFEE performed comparably, and both were significantly less variable than the older VST LAB II.
- Equipment tested
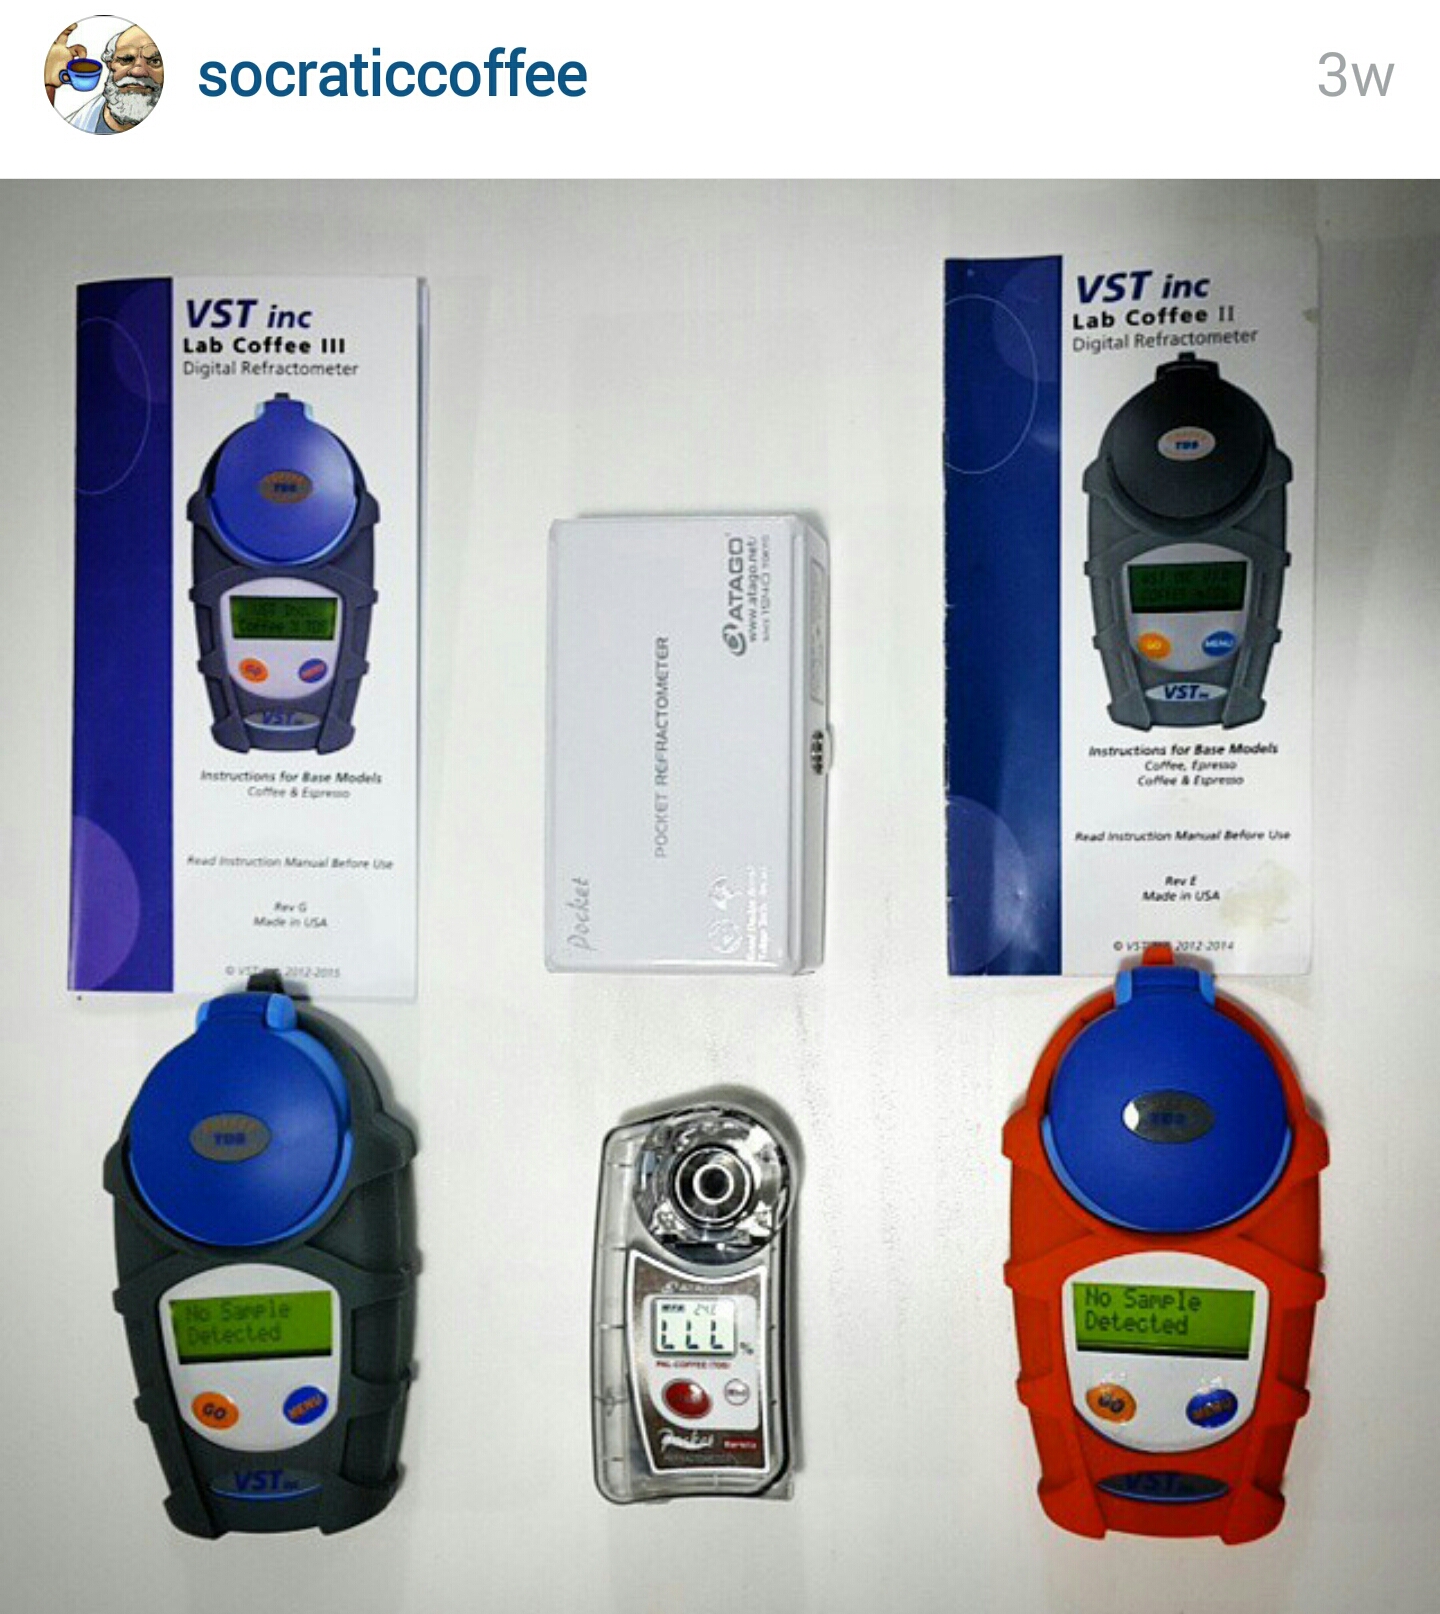
- VST LAB Coffee II, VST LAB Coffee III, Atago PAL-COFFEE
Updated: 26 May 15
Abstract
Continuing from our previous post on refractometer comparisons, the goal of this study was to examine the measurements from three refractometers advertised to measure the total dissolved solids (TDS) content of coffee. In three separate experiments, the VST LAB Coffee II Coffee & Espresso Refractometer, VST LAB Coffee III Refractometer, and Atago PAL-COFFEE Refractometer were compared with 10 samples for each device. Testing procedures followed the VST recommended guidelines. In two of the three brew tests, there was no significant difference between the VST LAB Coffee III and the Atago PAL-COFFEE. For all three brews, there was a significant difference with the VST LAB Coffee II refractometer and the other devices (p = 0.00 for all comparisons).
Disclosures
We have no vested interest in any of the products being tested.
Authors
Jeremy and Joe
Introduction
Coffee is most often thought of as a solution, consisting of a solvent (water) and solutes. As described in much greater detail by others (e.g., Flament 2002; Andueza et al. 2003), over 600 potential flavor-impacting compounds have been identified in the seed. While not all compounds contained within the roasted beans are soluble, the resulting complex beverage that is brewed is considered by many a homogenous mixture composed of a single phase with particles that cannot be seen by the naked eye, thus making its soluble content quantifiable through standard means of solution concentration measurement such as refractive index.
In simplistic terms, the index of refraction describes how light passes through a medium. The angle of refraction as light passes through the coffee (i.e., how the light bends when passed through the solution) is often captured by a photodetector and the resultant refractive index calculated. This is a method typically used to assess the concentration of a solute in an aqueous solution, most often called the total dissolved solids (TDS) percentage (for more in-depth explanation on refractive index and its application to coffee, see Clarke 1989).
At least two consumer-grade refractometer product lines have been marketed specifically for coffee solute concentration assessment: a series marketed by VST and a series produced by Atago. Both have offered several models. Early iterations of what would become the VST refractometer were produced by Atago, who has been developing refractometer technology for over 70 years. VST then switched to Reichert Techologies refractometer hardware (Reichert has a 150-year history of producing optical measurement equipment), originally called the R2 mini but now sold as the Brix/RI Chek. The current models tested here are based on the hardware of the Misco Palm Abbe. VST branded equipment has custom-loaded software on its refractometer units to provide a TDS of coffee/espresso directly without the need for correlation tables. Atago has been marketing their own coffee-specific refractometer calibrated with an “industry scale” specifically for coffee, providing a direct readout of either Brix (a scale based simply on the refractive index of sucrose in an aqueous solution) or correlated TDS reading. For anything other than sucrose, the Brix scale only provides an approximate dissolved solid content reading.
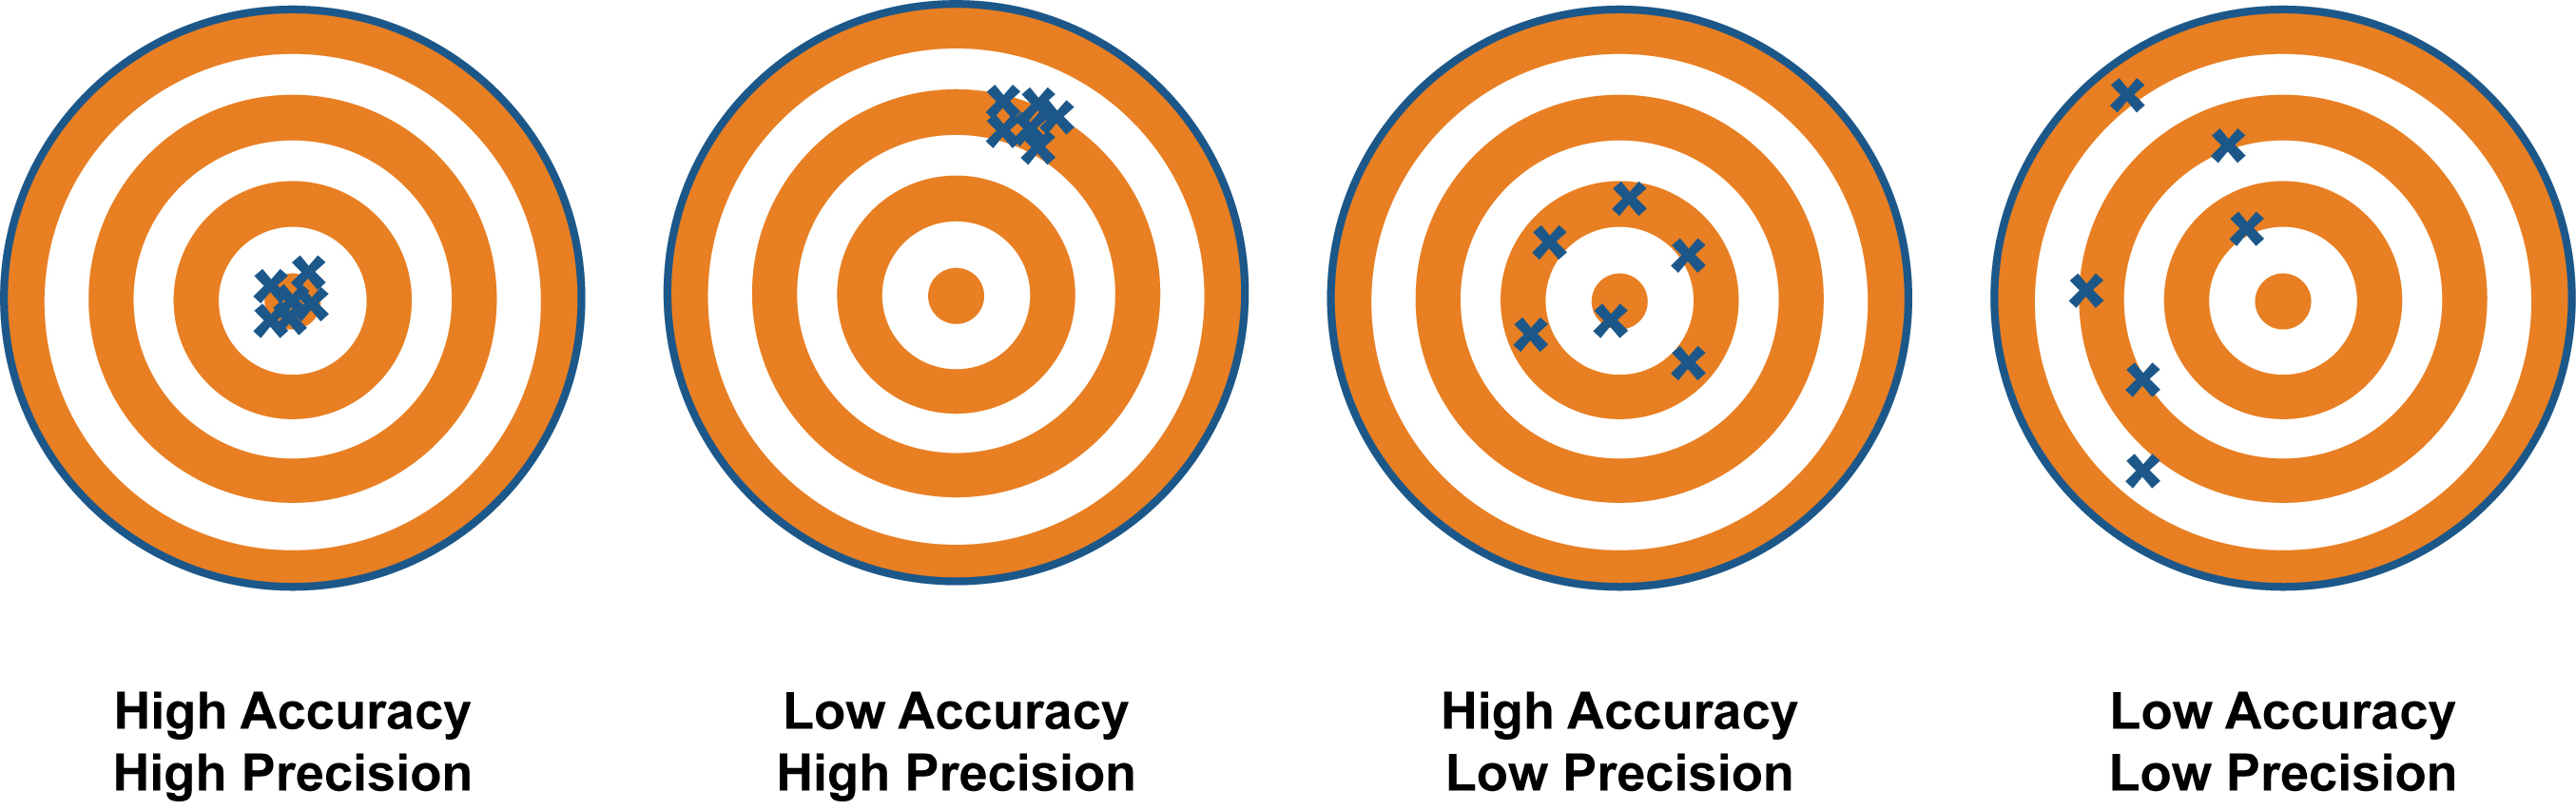
We set out to test the performance of three devices compared against each other, not assess their individual precision or accuracy against stated manufacturer specifications. To test precision and accuracy within a device would require us to compare against another metric of TDS quantification and a known reference solution. This is an important point to make and is illustrated in the figure below:
Methods
The VST devices used were the VST LAB Coffee III 4th Generation Refractometer (stated range: 0.00-20.00% TDS; TDS resolution 0.01%; precision +/-0.01%; accuracy from 0.00-4.99% of +/- 0.03% and from 5.00-20.00% of +/-0.05%; temperature range of 15-40C) and the LAB Coffee II (Coffee & Espresso) Refractometer (stated range: 0.00-20.00% TDS; TDS resolution 0.01%; precision +/- 0.03%; accuracy from 0.00-4.99% of +- 0.05% and from 5.00-20.00% of 0.10%; temperature range of 15-40C). The Atago device was the PAL-COFFEE (stated range: 0.00-22.00% TDS; TDS resolution 0.01%; accuracy in Brix of 0.10; temperature range of 10-100C; temperature resolution 0.1C). We recommend checking the companies’ sites for more information regarding device specifications. All refractometers were loaded with fresh batteries and, along with container of distilled water, placed on the test bench the night before to allow temperature to equilibrate to ambient room temperature (25C). Distilled water, using a conductivity-based TDS meter, contained 0 ppm and was used to zero all devices.
The coffee used for the experiment was Campos Pulped Natural “Ouro Verde” roasted for filter coffee.
Equipment used:
- Kalita stainless steel wave dripper
- Kalita filter paper
- Kalita carafe & Lid
- Bonavita 1.0 L digital variable gooseneck kettle
- Infrared gun
- FLIR thermal camera
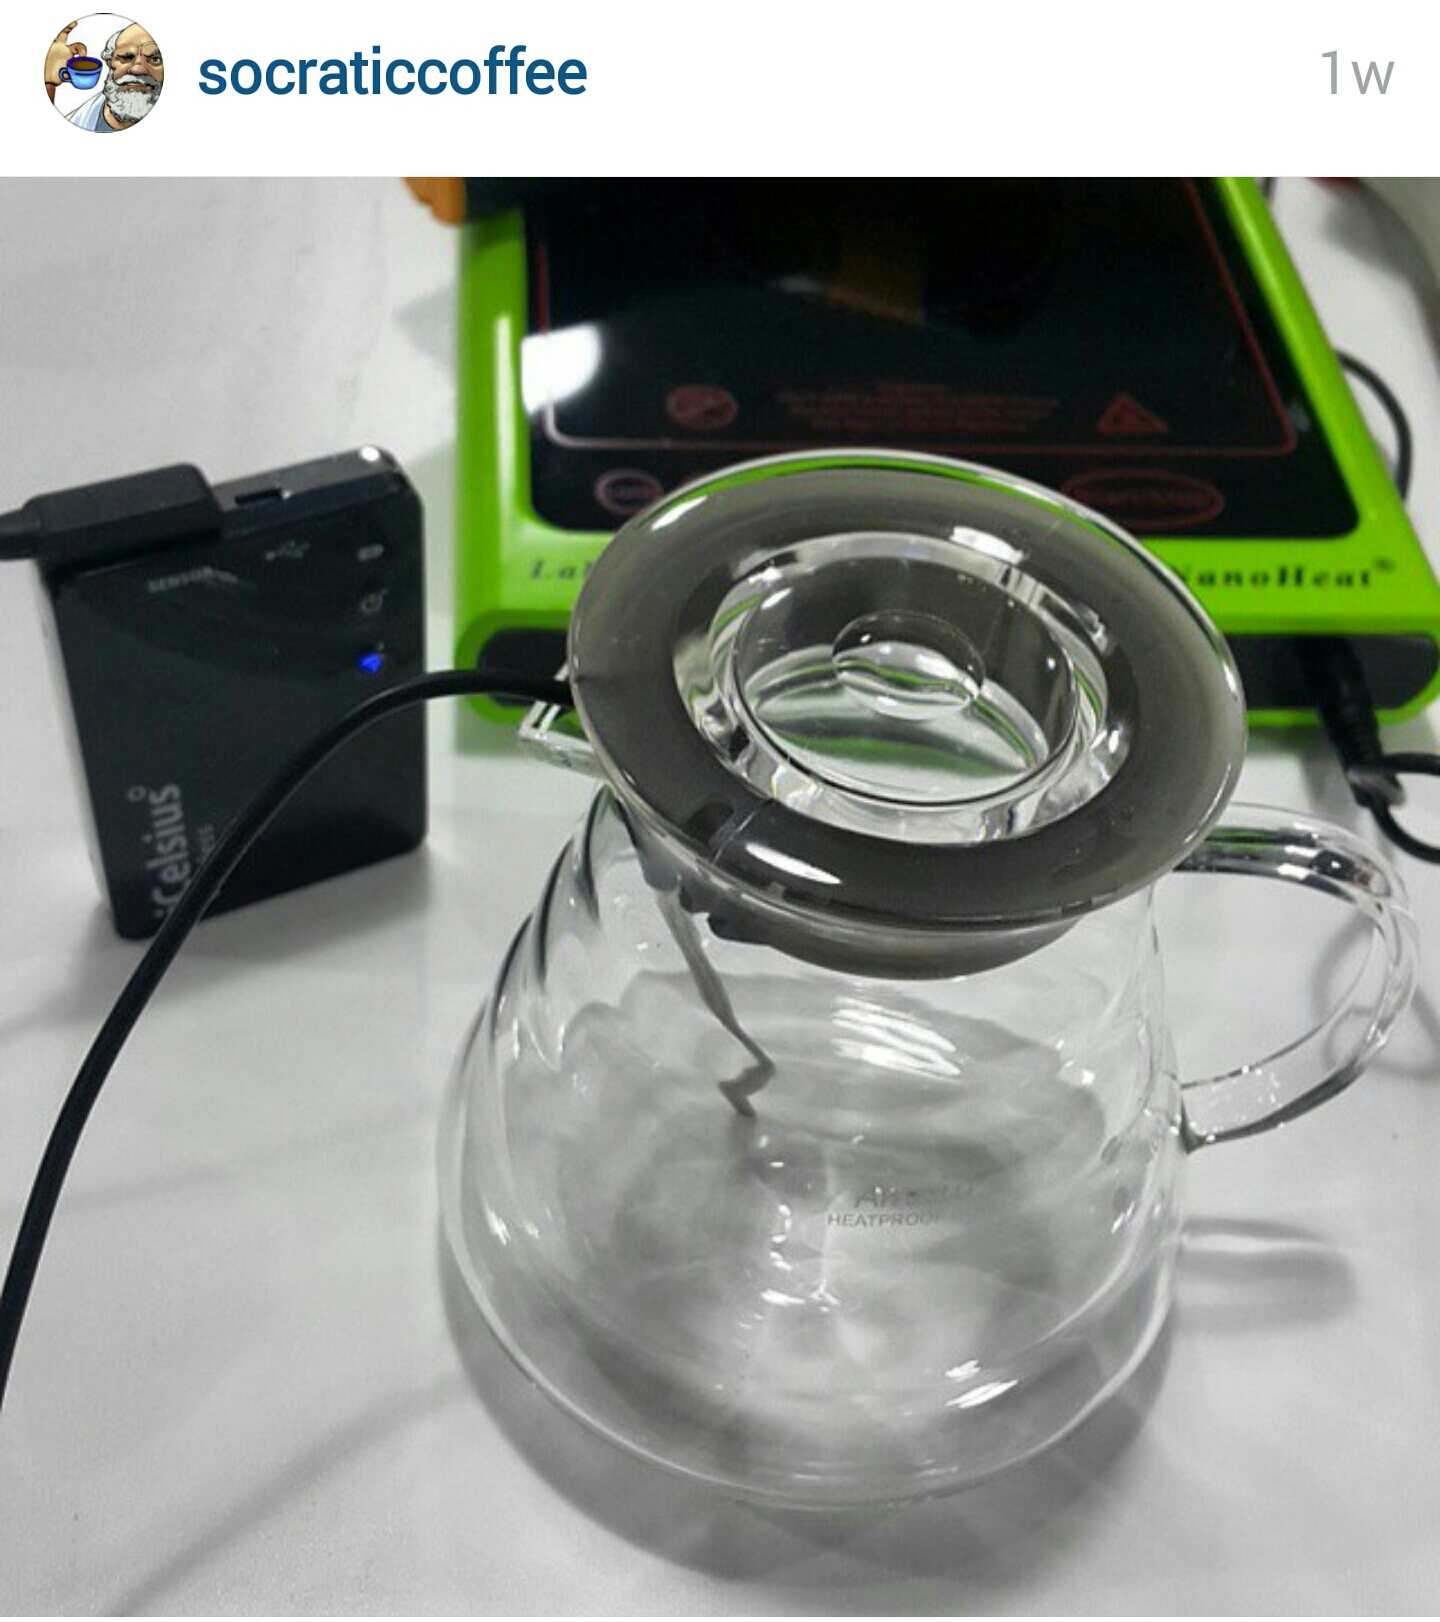
- iCelsius temperature probe
- AWS scale
- Ohaus Scale
- EK-43 Coffee Grinder
- Atago refractometer
- VST LAB II refractometer
- VST LAB III refractometer
- Pipettes
- Alcohol wipes
- Ceramic cups
- Tissues
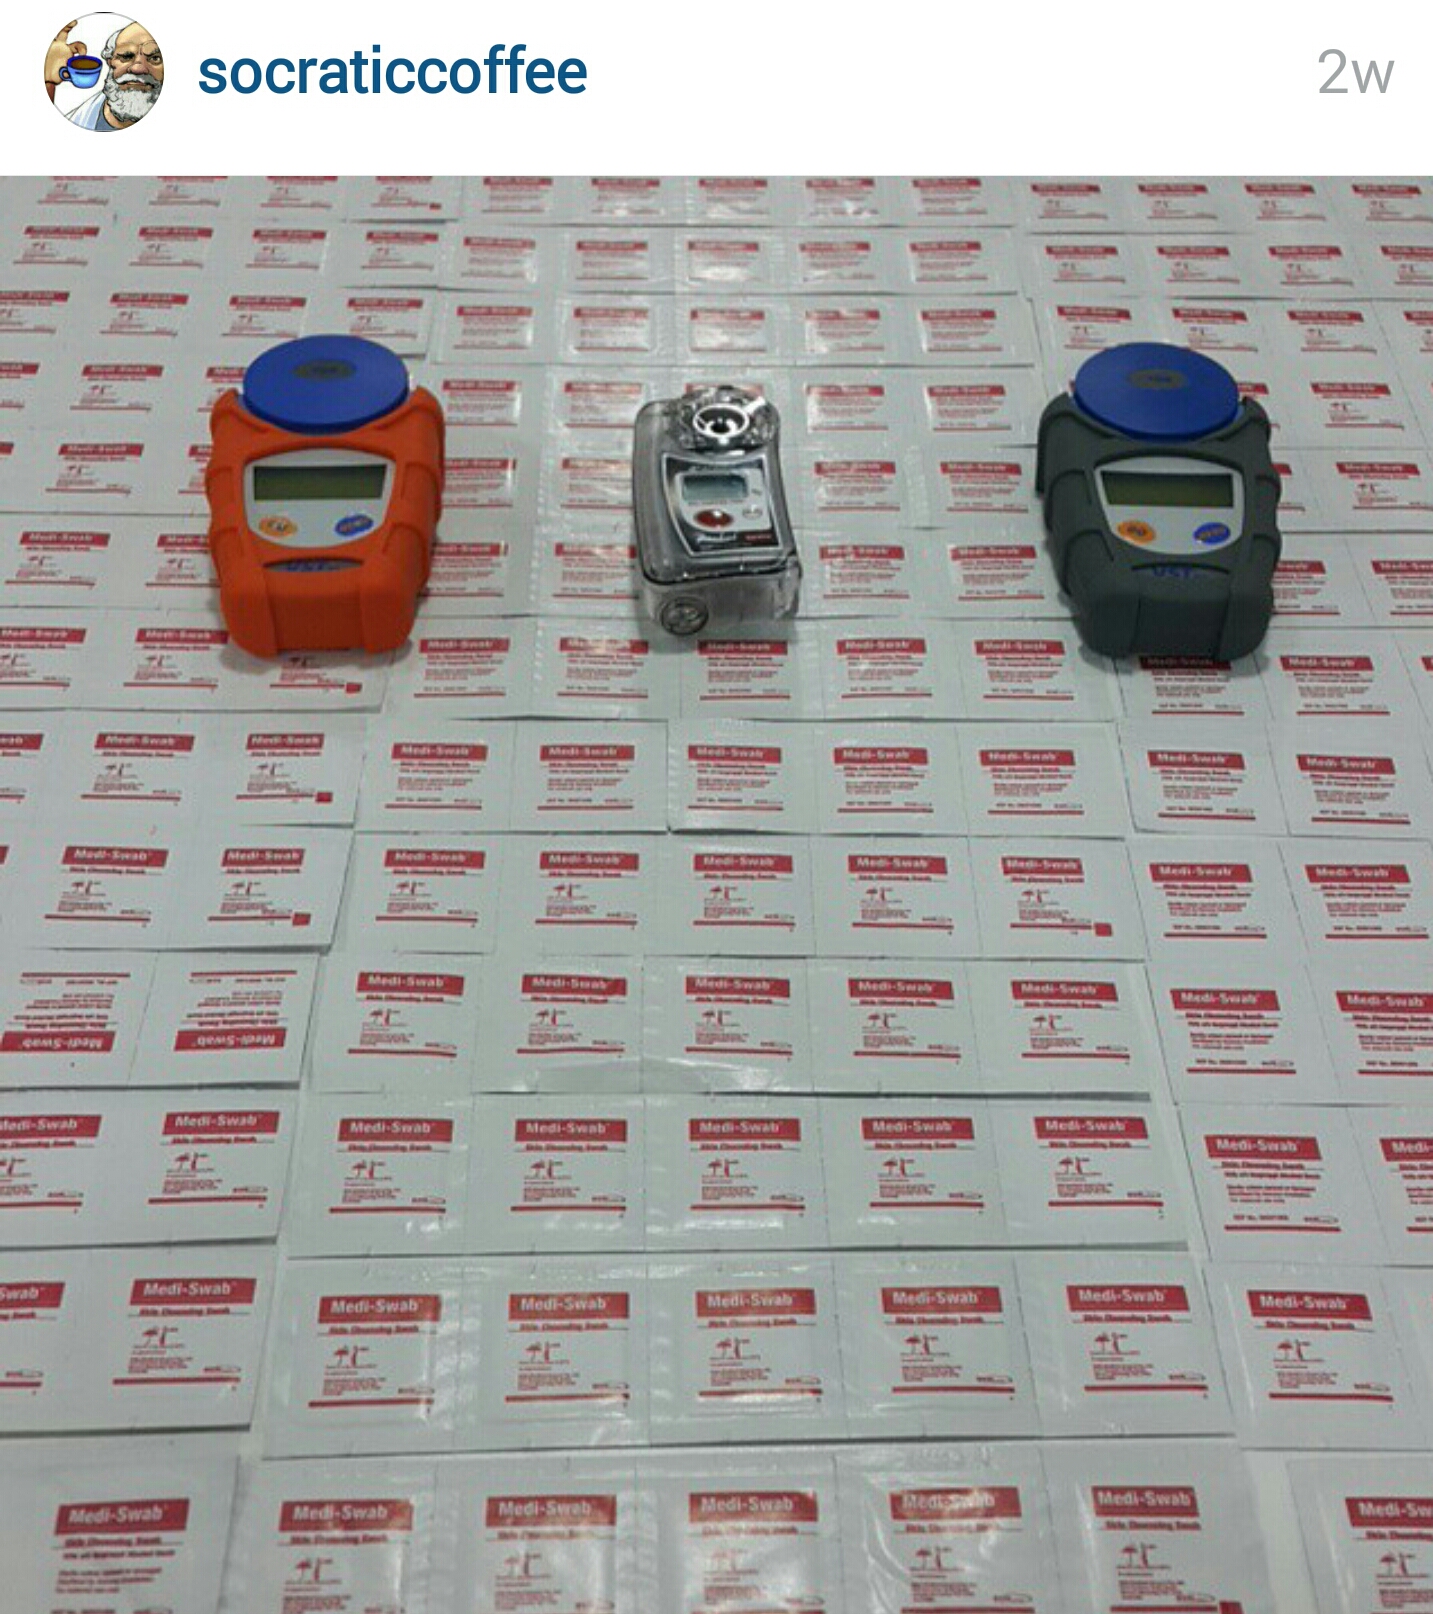
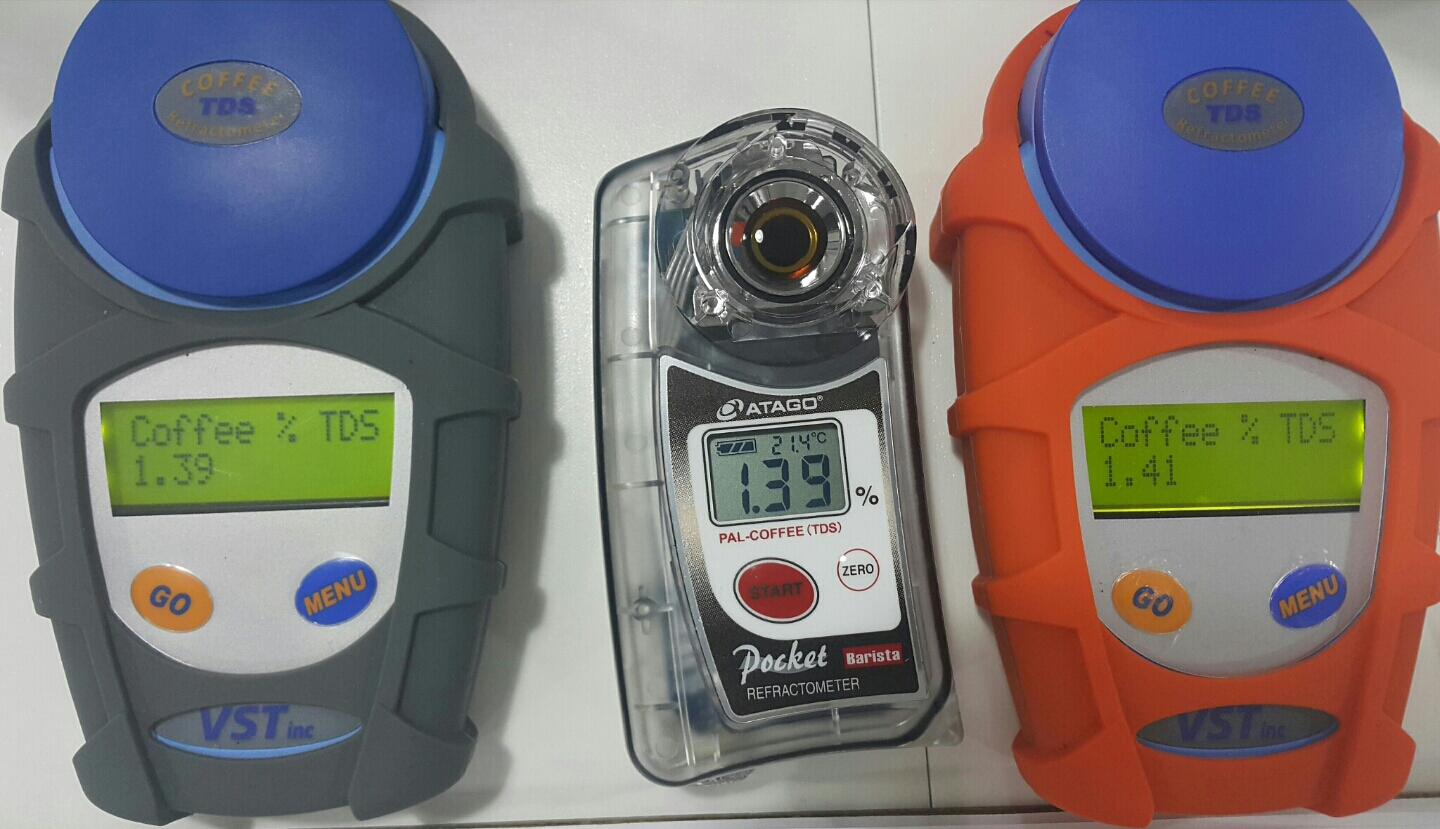
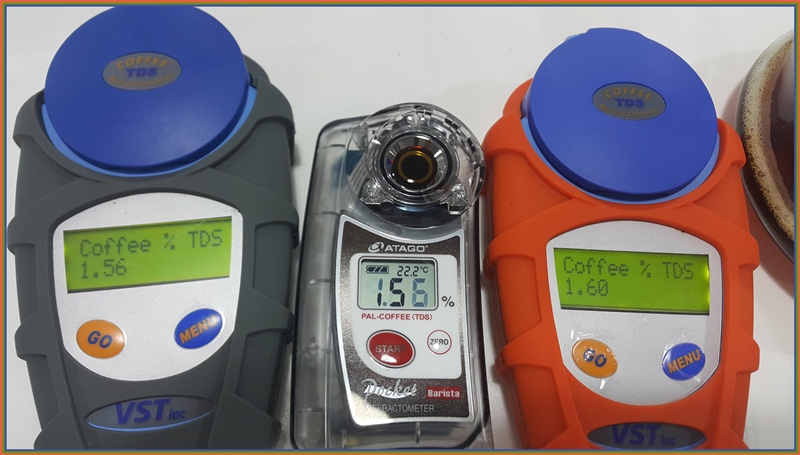
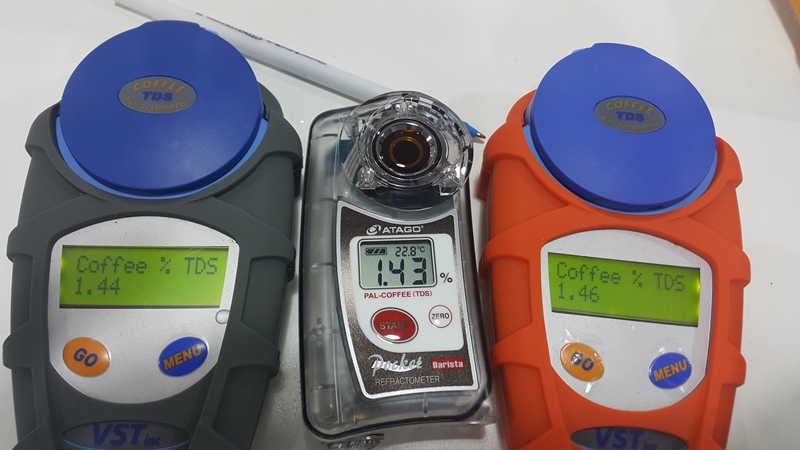
Pour over coffee was brewed at 94 degrees Celsius at a ratio of 1g coffee to 17g water. The brew was 15g of coffee to 255g of water, with a total time of 2 minutes and 45 seconds. No stirring or agitation was applied during the brew. Immediately after brewing, the carafe was covered with a fitted lid and allowed to cool to the recommended temperature of 30C. For all three brews, sample temperature at the start of the readings ranged from 28-25C. The syringe was rinsed with the brew before taking each sample. After swirling the coffee in the vessel, a sample of 6-8ml was siphoned from the syringe and placed into a ceramic cup to rest for 30 seconds. Again, after swirling the sample in the cup, a pipette, which was also rinsed with the brew, was then used to transfer the sample and debit it onto the wells for each refractometer. After 30 seconds in the wells, a sample value was recorded for each device. A new, unused alcohol pad was opened to clean each device after each sample (90 total alcohol pads).
Results
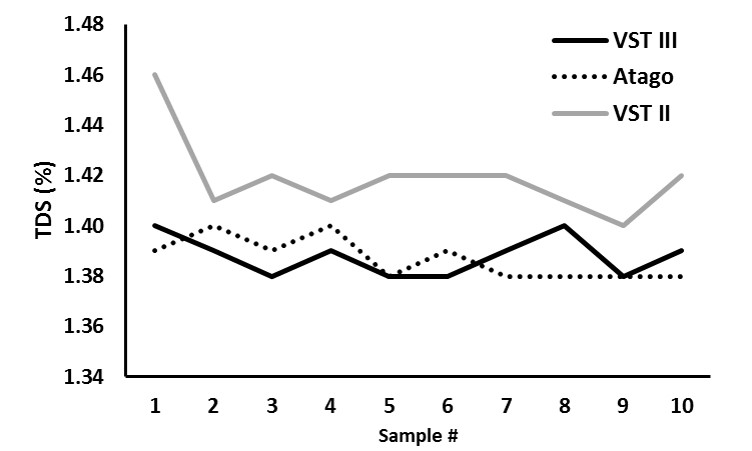
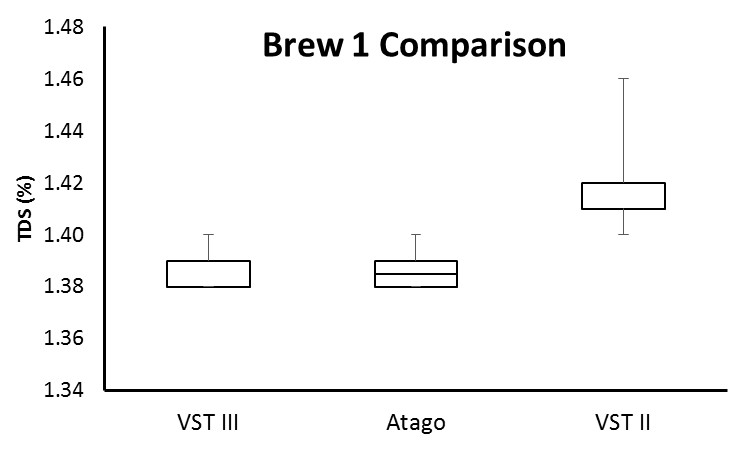
*Brew #1
*
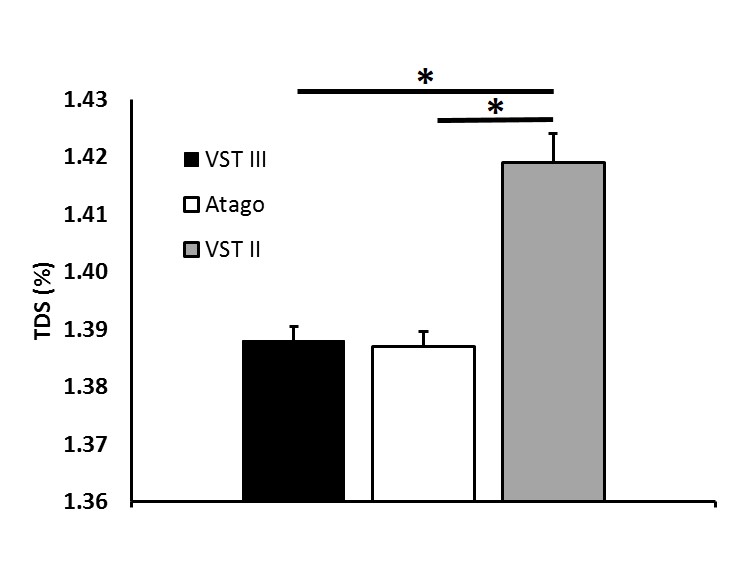
An analysis of variance (ANOVA) demonstrated a significant difference between device type, F(2,27) = 25.83, p = 0.00. Post hoc analysis revealed a significant difference between the VST II and VST III (p = 0.00) and VST II and Atago (p = 0.00) but not the VST III and Atago (p = 0.78).
Brew #2
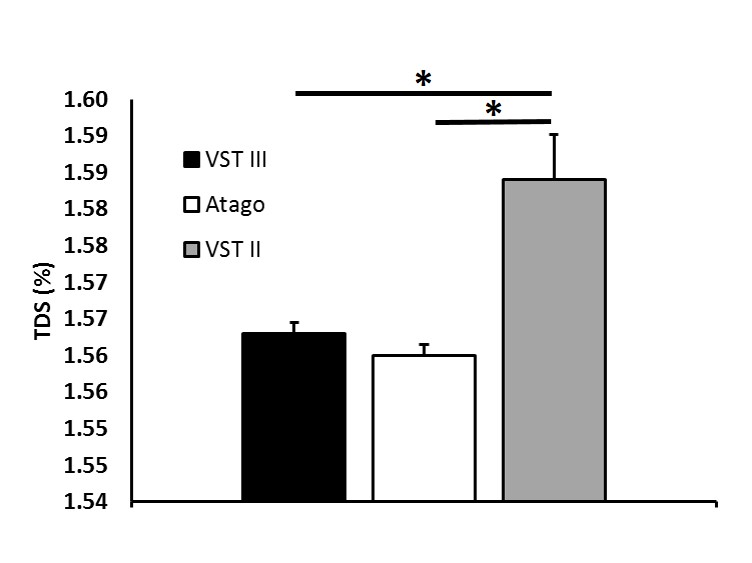
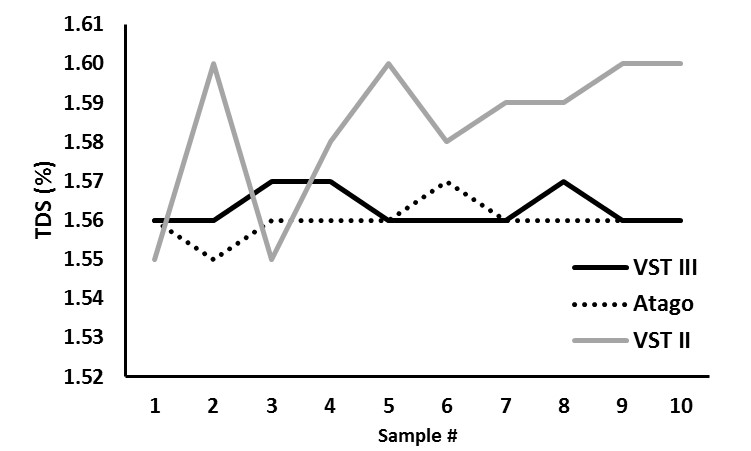
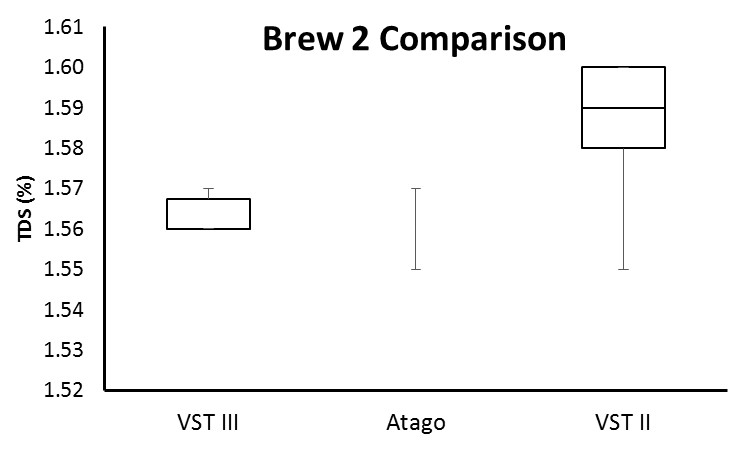
An ANOVA demonstrated a significant difference between device type, F(2,27) = 11.99, p = 0.00. Post hoc analysis revealed a significant difference between the VST II and VST III (p = 0.00) and VST II and Atago (p = 0.00) but not the VST III and Atago (p = 0.78).
Brew #3
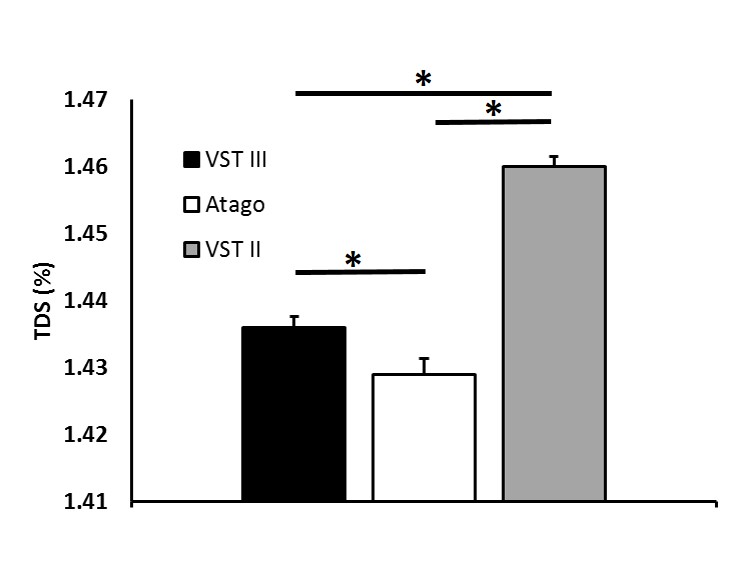
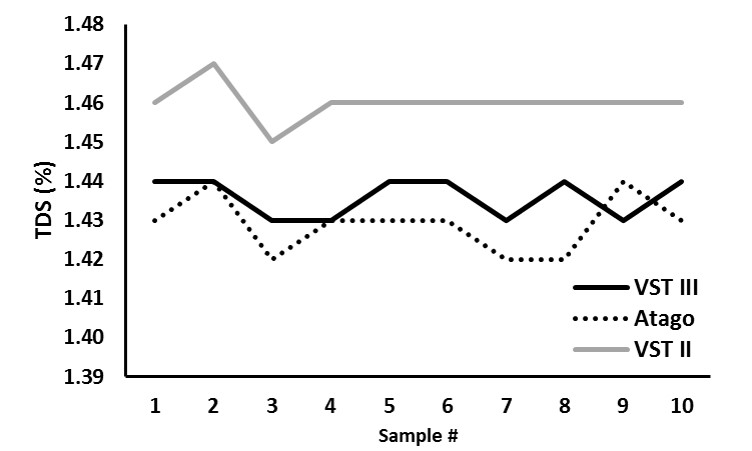
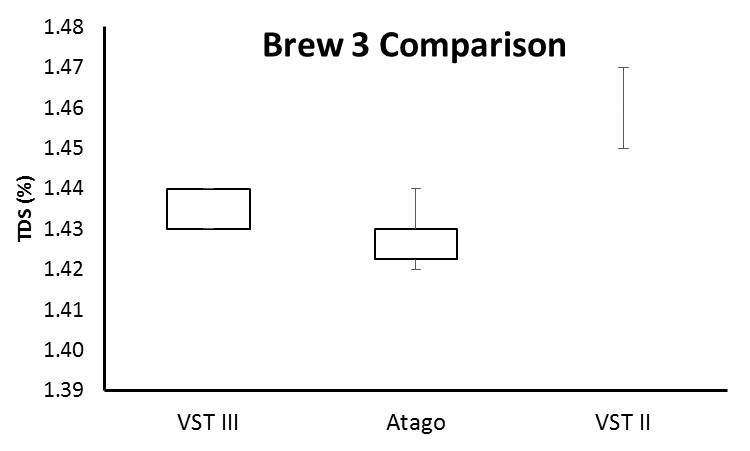
An ANOVA demonstrated a significant difference between device type, F(2,27) = 76.74, p = 0.00. Post hoc analysis revealed a significant difference between the VST II and VST III (p = 0.00), VST II and Atago (p = 0.00), and the VST III and Atago (p = 0.02).
(Raw data can be downloaded in a tab delimited text file here. As always, while we offer the data for your personal use, we kindly ask that you send a message to socraticcoffee@gmail.com before posting or presenting it in any public forum and attach appropriate acknowledgement.)
Conclusions
Overall, the VST III and Atago devices performed comparably, both demonstrating significantly less variability compared to the VST II. While a statistically significant difference was seen in the third brew between the VST III and Atago, the average difference in TDS measurement for that brew was 0.007. We leave it up to the reader to determine whether or not a statistically significant difference is meaningful in his/her application of refractometry (and whether or not it falls within the devices’ stated measurement capabilities and tolerances).
As stated in the introduction section, we did not set out to verify the accuracy and/or precision of the individual devices compared to their manufacturer stated specifications. To reference the earlier picture of accuracy and precision in a target practice setting, we do not know the location of the “bullseye”. Any of the three devices could be the most accurate. Some sense of device-specific precision may be perceived through standard deviation and is perhaps best illustrated in the box-and-whisker plots (i.e., the spread of the plot for a device); however, our purpose and methodology were not to assess device-specific precision, so we have no analysis regarding that aspect of the data. We did not assess if the measurements cluster in the correct area (because we do not know where the correct area is–accuracy), instead we assessed if the clustering of measurements from each device was different from the others, which is influenced by the tightness of the clustering within a device as well as the separation of the clustering between devices.
References
Flament I. (2002). Coffee Flavor Chemistry. West Sussex, England: John Wiley & Sons, Ltd.
Andueza S., Maeztu L., Pascual L., Ibanez C., Paz de Pena M., Cid, C. (2003). Influence of extraction temperature on the final quality of espresso coffee. Journal of the Science of Food and Agriculture, 83, 240-248.
Clarke R.J. (1989). Water and Mineral Contents. In R.J. Clarke & R. Macrae (Eds.), Coffee: Chemistry (Volume 1) (pp. 42-82). New York, NY: Elsevier Science Publishers LTD.
Equipment tested: VST LAB Coffee II, VST LAB Coffee III, Atago PAL-COFFEE. Also used: Kalita Wave (stainless), Bonavita gooseneck kettle, AWS scale, Ohaus lab scales, Mahlkönig EK43.
Socratic Coffee (2015). Measuring Total Dissolved Solids: A Refractometer Comparison (Part II). Study No. 3. socraticcoffee.com/2015/05/measuring-total-dissolved-solids-a-refractometer-comparison-part-ii/