Examining the Impact of Particulate Matter in Refractometry for Coffee Assessment
SupportedVST syringe filters remove much, but not all, of the particulate matter that skews refractometer readings. They also remove some dissolved solids and release particles of their own.
- Claim tested
- Particulate matter skews refractometer readings, and VST syringe filters remove it.
- Result
- ● Supported
- Equipment tested
- VST syringe filters, Atago PAL-COFFEE, Atago RX-007α, VST LAB Coffee III
Introduction
Refractometers work on the principle of refractive index (RI). For a clear, coffee-related explanation, we suggest reading this explanation. To think of it simply, a refractometer consists of a light emitter and a light detector. The sample is placed between these two, allowing for some deviation in the expected path of the light (i.e., your zeroed condition). Since the bend of the light through the solution is absolutely critical for measurement accuracy, particles that interfere with the passage of the light are undesirable. Enter titanium dioxide (TiO2). Used in a variety of applications to include paint, sunscreen, and food coloring, among its numerous interesting properties, TiO2 is well-known for its high efficiency to scatter light via its high refractive index and small particle size. Think of the refractive index in a sample as your “signal” and TiO2 as deliberate “noise”.
Particulate matter—or anything that does not transmit light (e.g., nondissolved solids)—should not, theoretically, contribute to a solution’s RI since it does not bend the light. Unfortunately, this is not so clear cut as these particulates may prevent light from cleanly transmitting from the emitter to the detector. Further, the assumption that the particulate matter is not transmitting any light may not be entirely correct. Though our previous work with the VST filters suggested that the total dissolved solids (TDS) content of espresso actually decreased when the filters were used–we considered that this could be due to light scattering affecting the detector/algorithm. And, perhaps, our measurements were suffering from noise caused by that scattering. Particulate matter whose size approaches the wavelength of light in the refractometer’s emitter (e.g., yellow light, as in what Atago/VST most likely use, corresponding to 570-590 nm) will increasingly scatter light. Such scattering, although it does not directly concern RI, can perturb its detection. Much of this depends on the detector, amount of particulate, and how the actual detector optical qualities and software respond to such sample noise.
Pigment grade titanium dioxide also presents a very high RI (about 2.6), so, as mentioned previously, it does refract some light. Things get complicated when you have a large RI mismatch between suspended particles, like TiO2 and water (RI = 1.3). The first solution tested (distilled water only) is to observe how distilled water plus TiO2 affects measured RI. This is a control condition, adding only insoluble material (i.e., TiO2). Subsequent solutions incorporated additional soluble or soluble/insoluble compounds. The TiO2 used here has a stated minimum size of 100 nm (.1 µm). We were unable to get a maximum particle size declaration from the manufacturer. Dissolved solids are often defined as particles which pass through a 2 µm filter, which is the assumed pore size of the VST syringe filters.
Hypotheses
- The addition of TiO2 will increase light scattering, leading to increasingly altered readings from baseline with the refractometers.
- Removal of particulate matter with the VST syringe filters will increase signal-to-noise ratio within the sample, allowing for a more consistent reading (i.e., similar to the “no TiO2” condition).
Methods
Equipment:
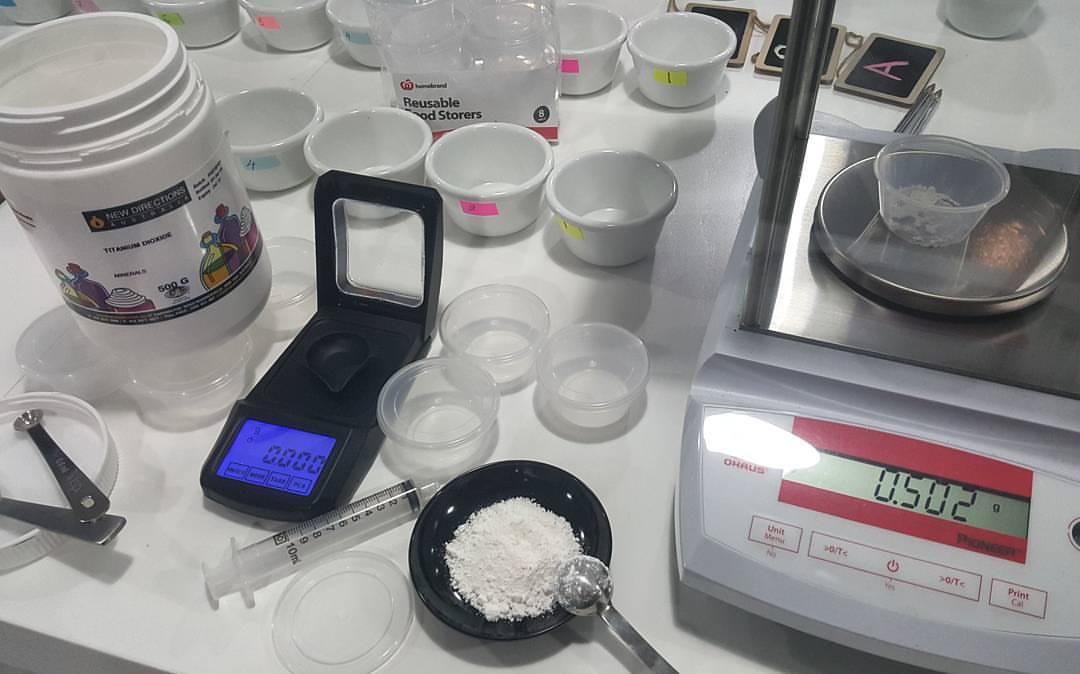
- TiO2, pigment grade, 500 g (New Directions Australia)
- “WT” Demineralized water
- EasyLog TH+ room temperature logger
- 4 X 2L Plastic containers with Lids
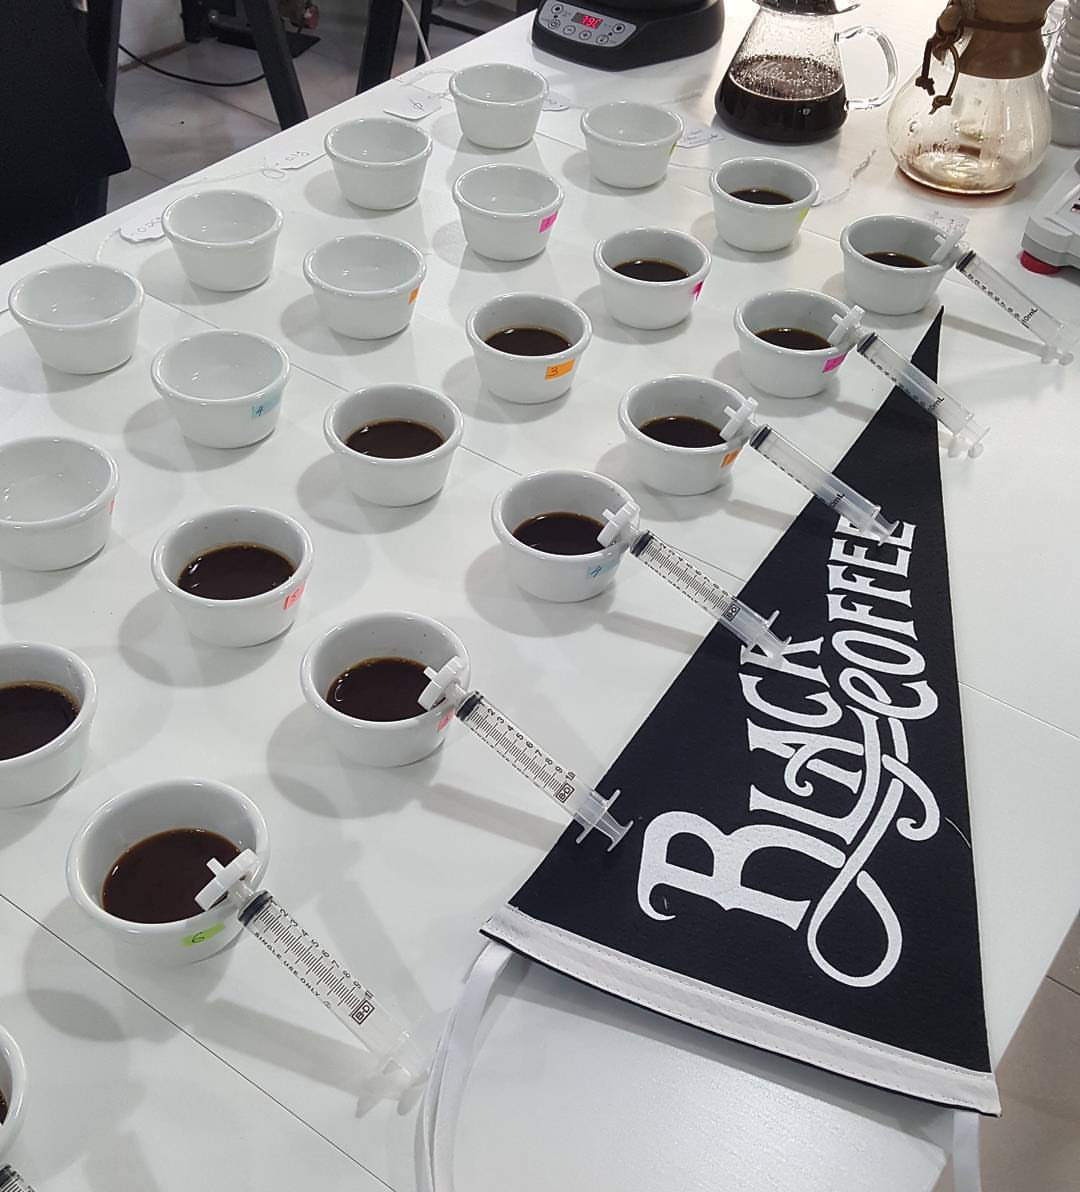
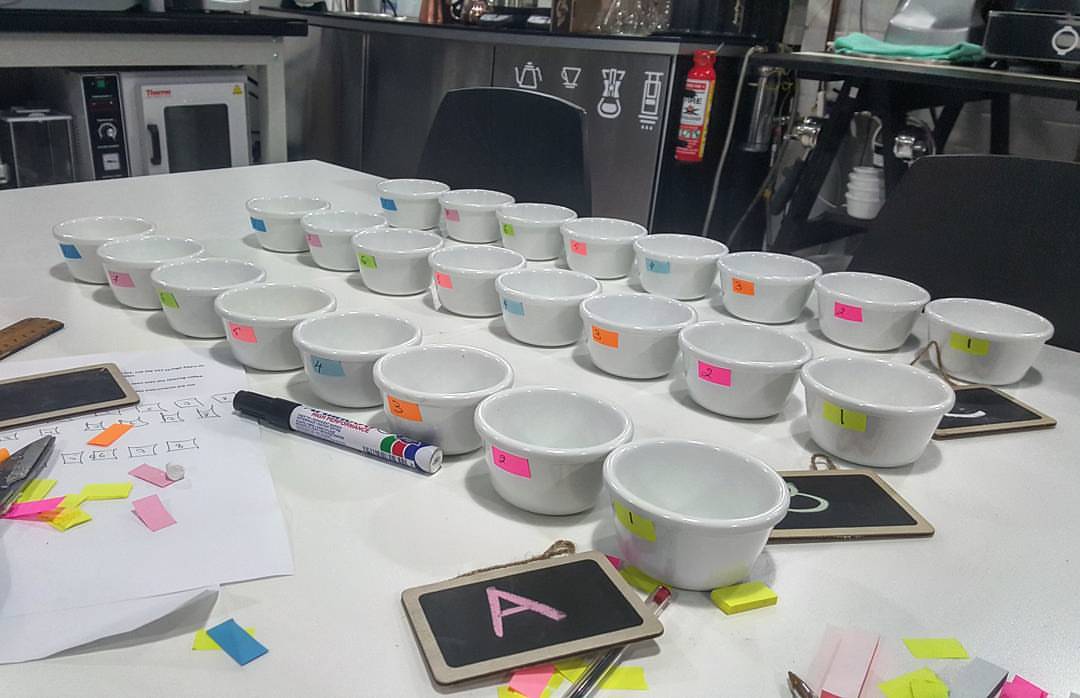
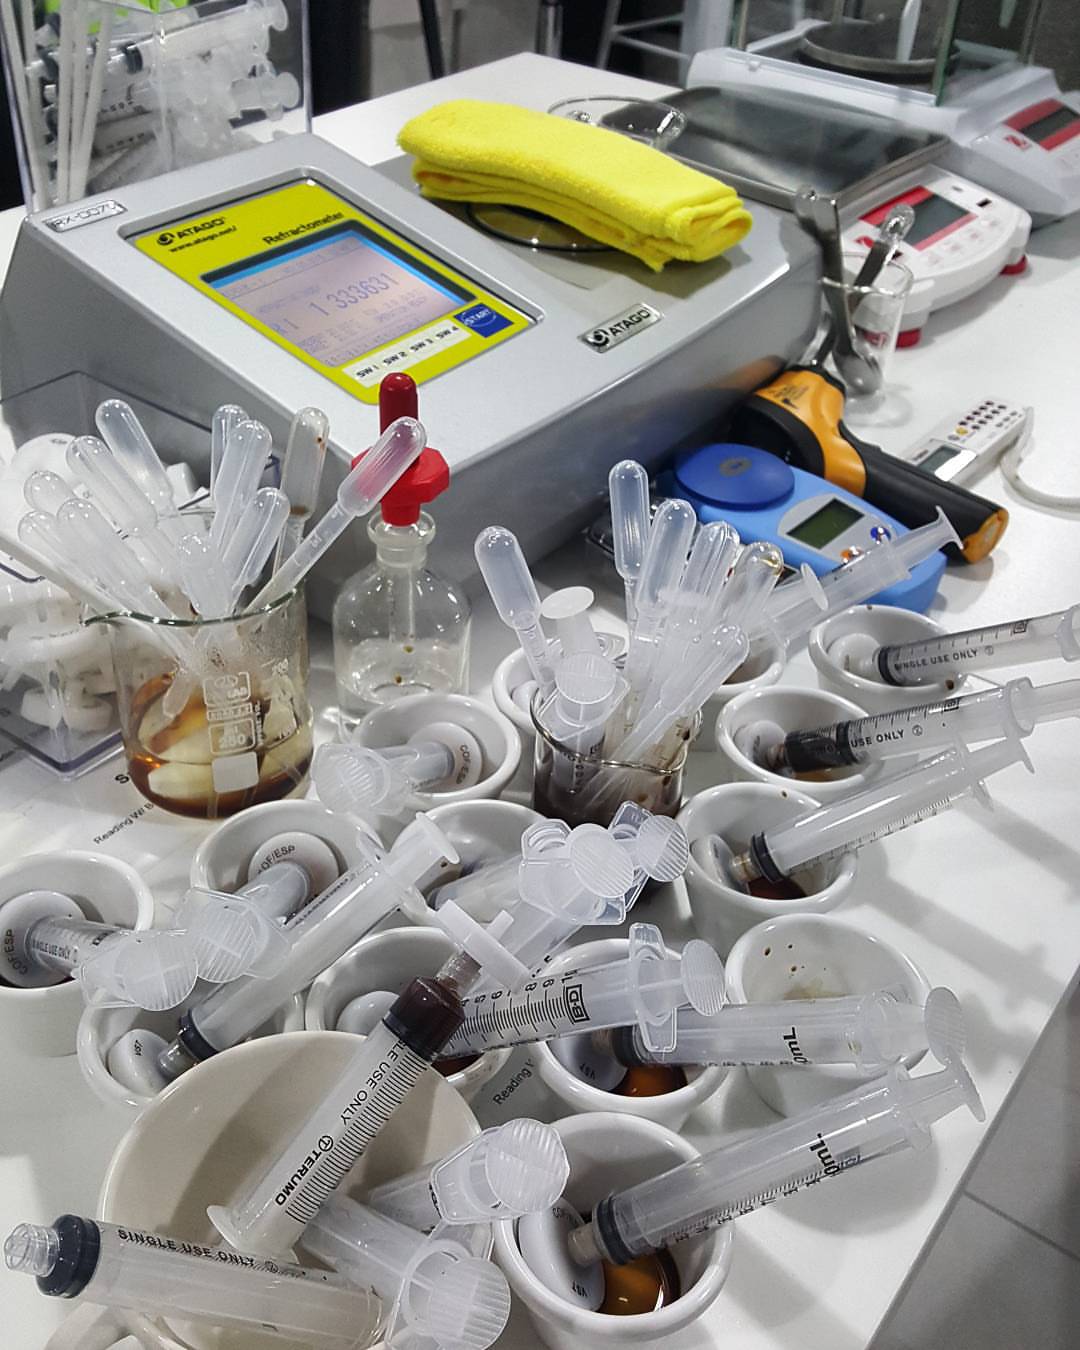
- 32 x 100 ml ramekins (for storing solutions)
- 32 x 40 ml ramekins (for storing samples)
- 60 ml syringes
- 10 ml syringes
- Spoons
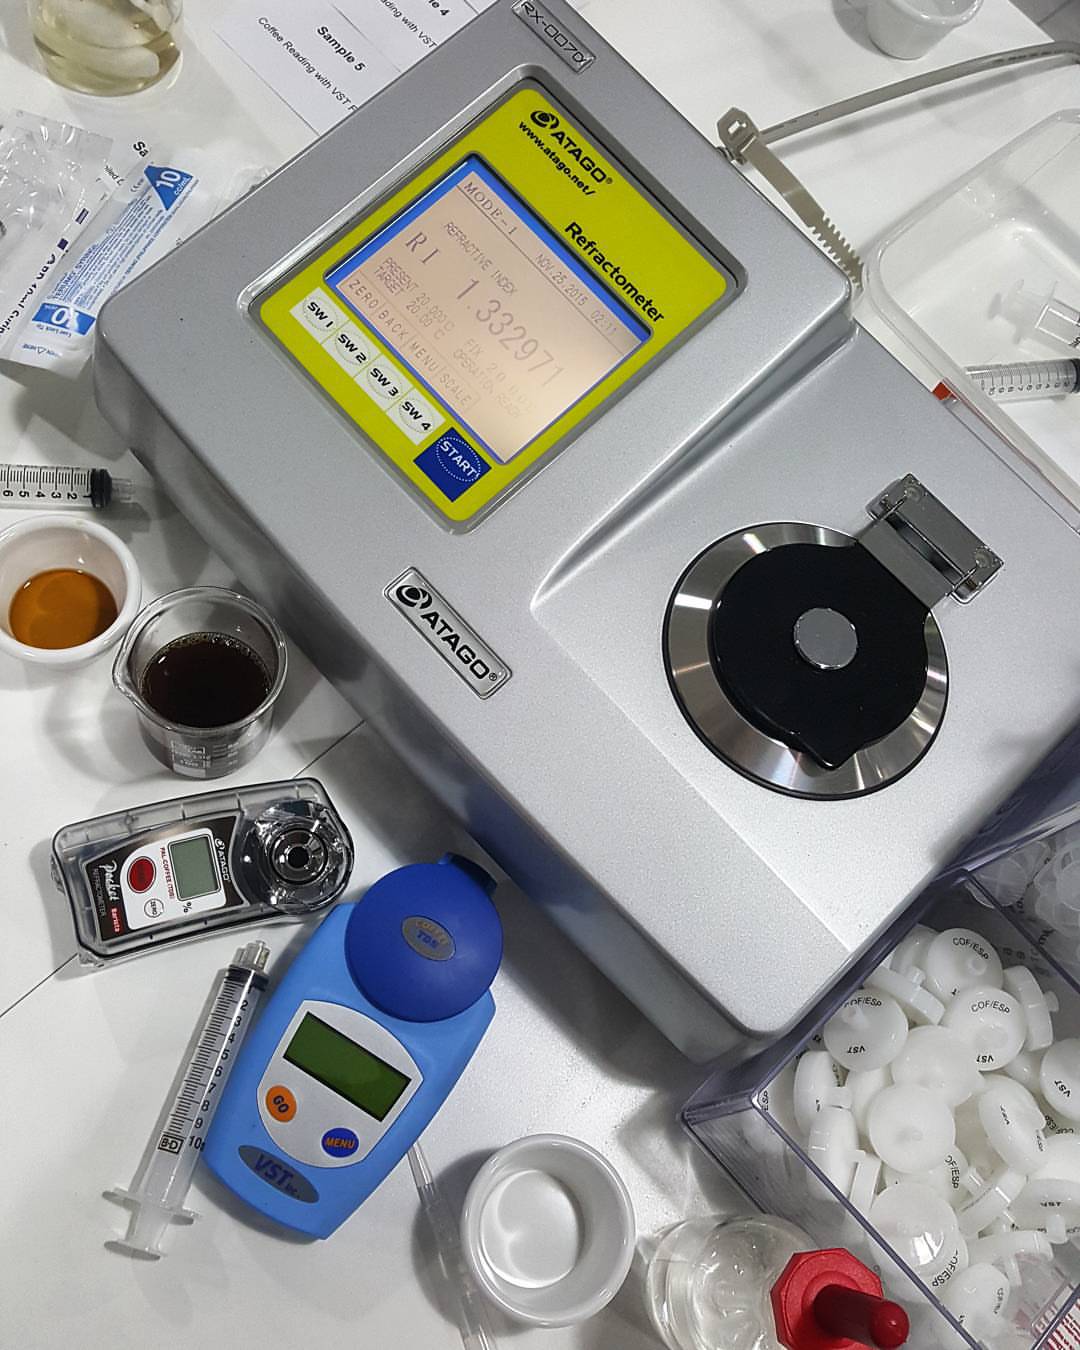
- VST syringe filters
- Atago PAL-COFFEE refractometer
- Atago RX007α
- VST LAB Coffee III refractometer
- Alcohol wipes
- Ohaus Navigator scales
- Ohaus Pas 213 (0.001 g to measure the TiO2/instant coffee/sugar/coffee)
- Plastic lab stirrers
- Nescafe Classic Instant coffee
- White table sugar
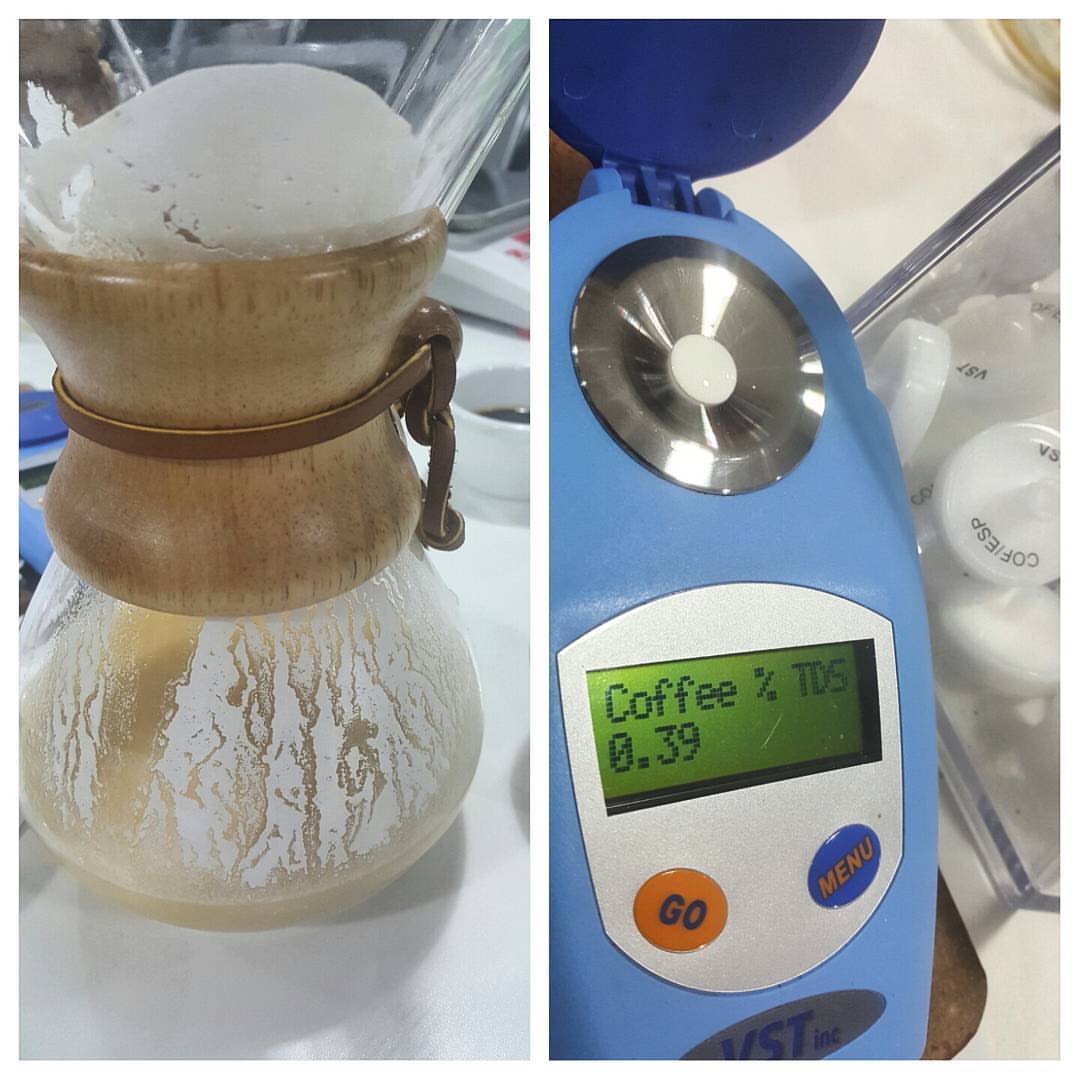
- Chemex & filter paper
- Bonavita kettle
- Pen and paper to record values
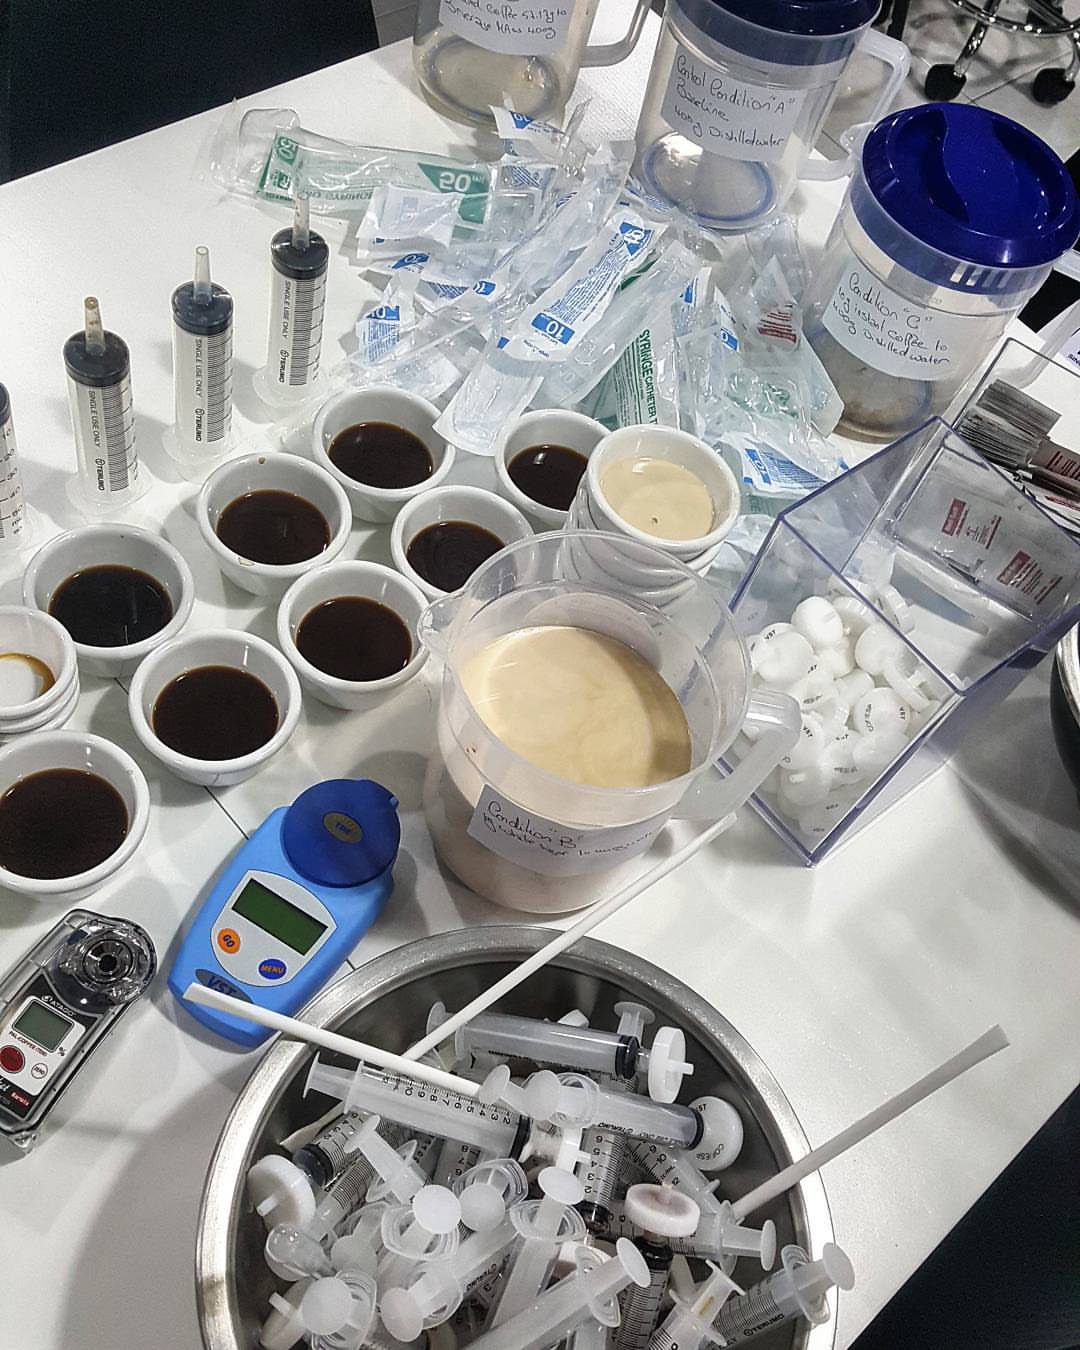
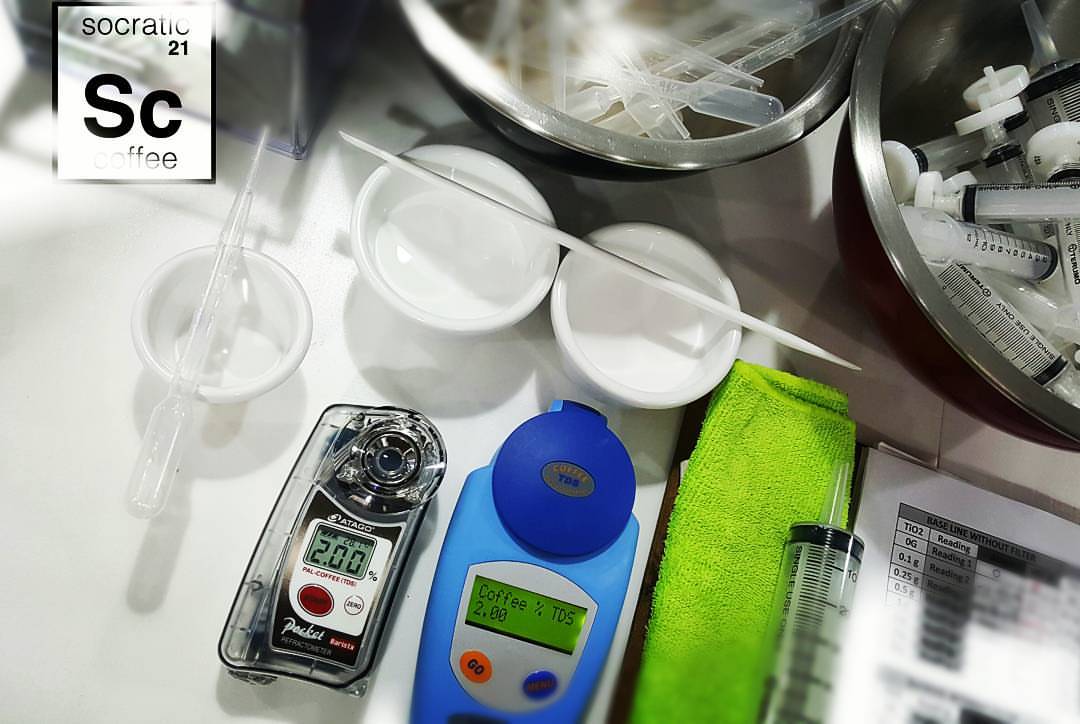
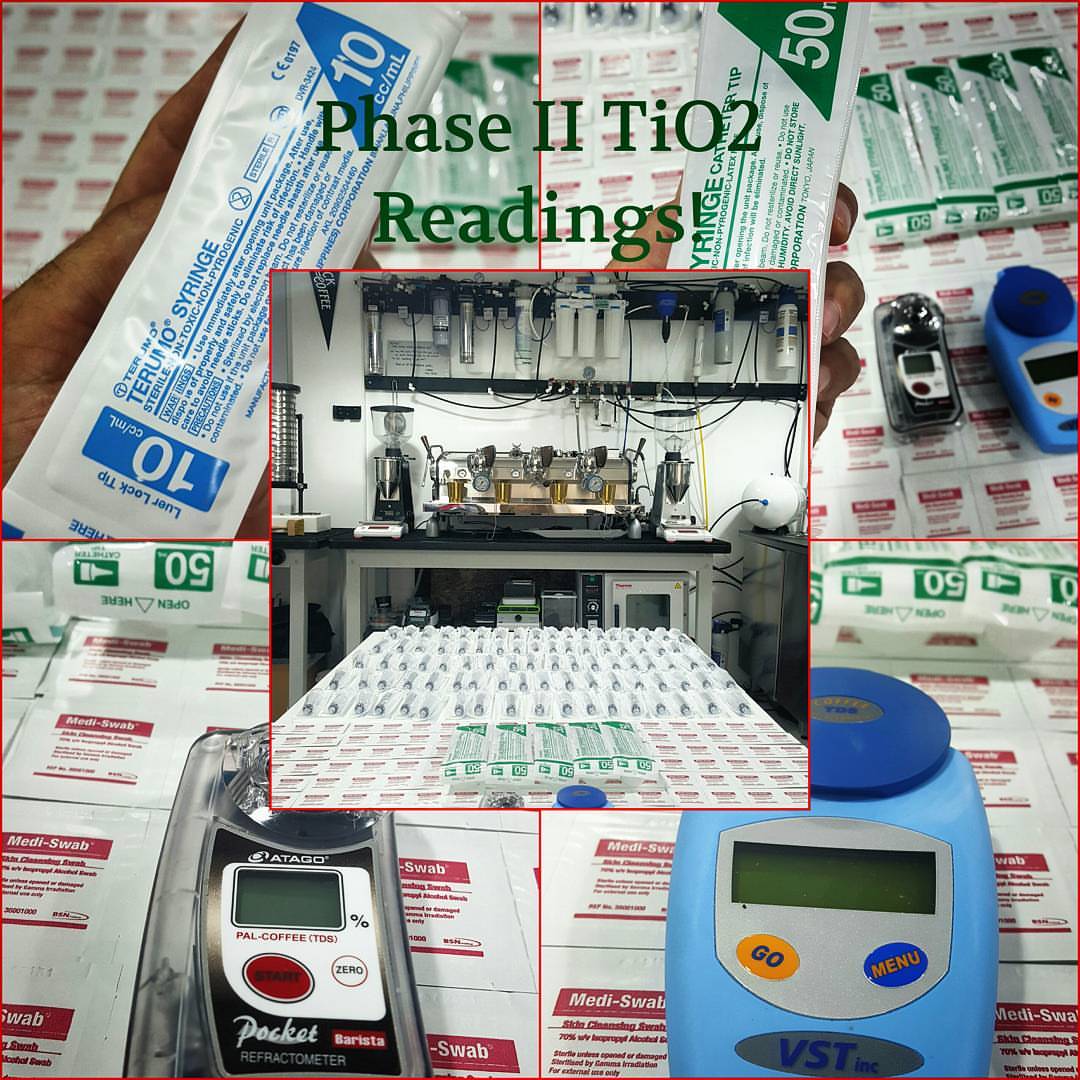
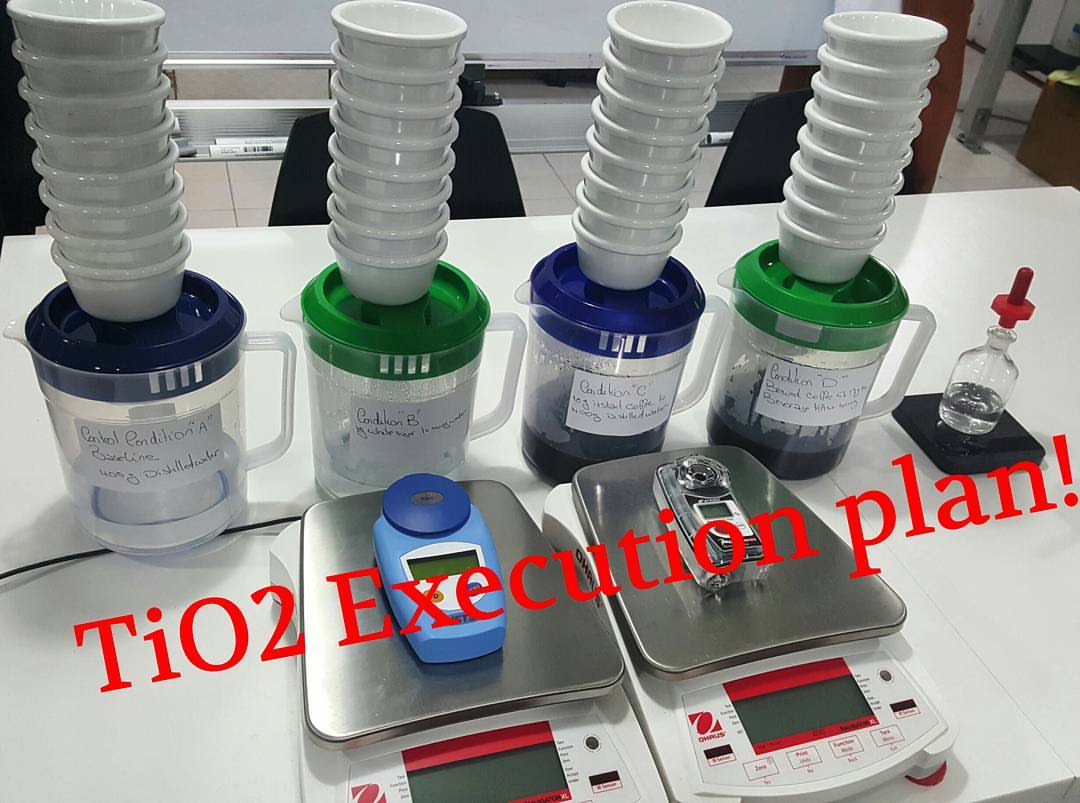
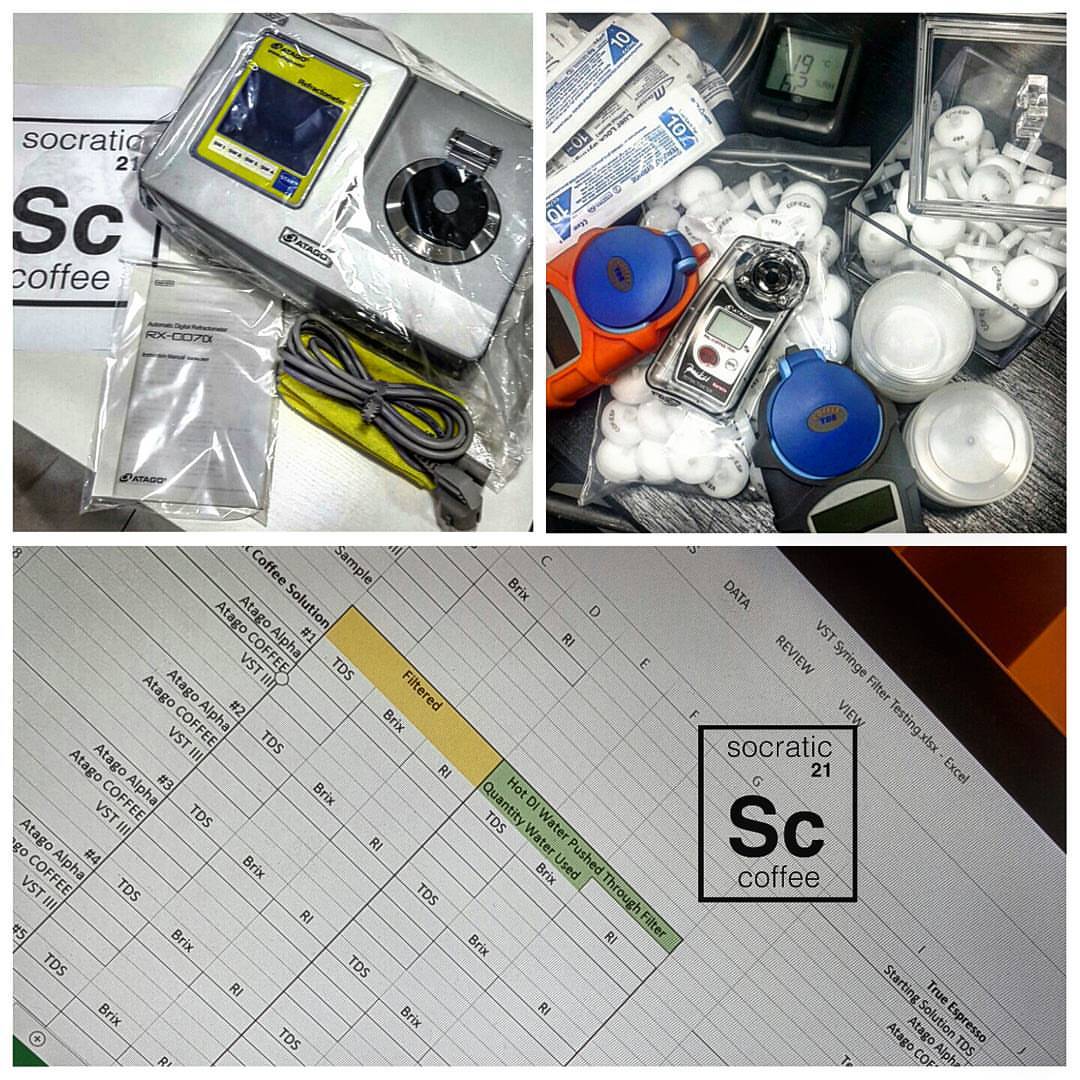
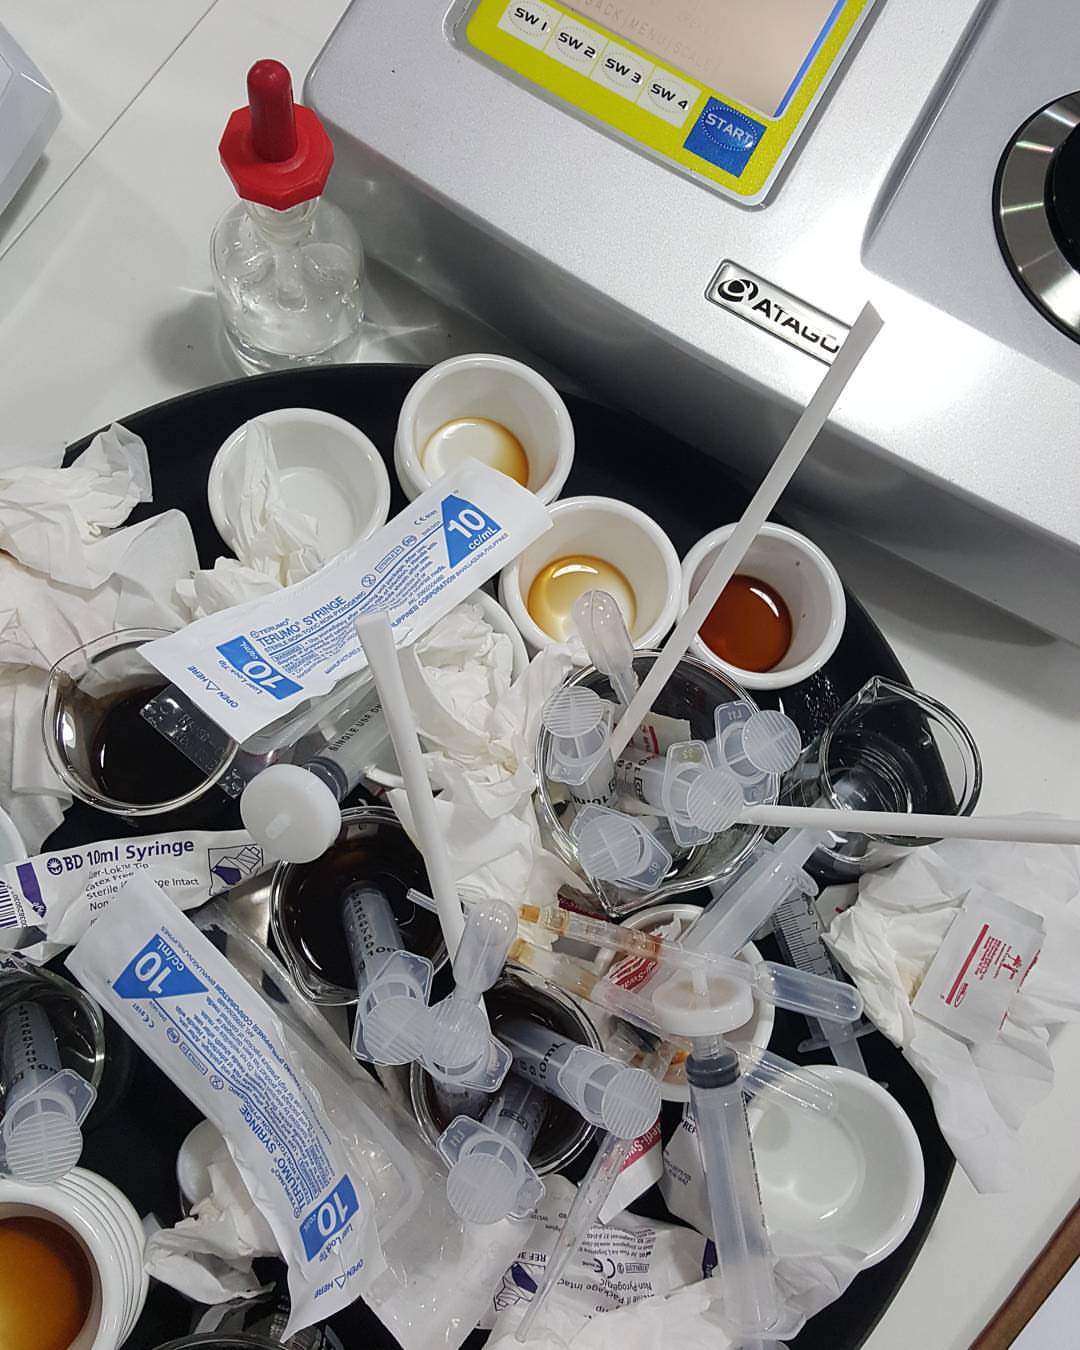
Procedures
Four solutions were created, all starting with distilled/demineralized water:
Condition 1 contained only distilled water
Condition 2 contained distilled water + sucrose (white table sugar)
Condition 3 contained distilled water + instant coffee (100% dissolvable solids)
Condition 4 contained brewed coffee made with distilled water
All kettles were rinsed with demineralized water prior to boil. For all conditions, the distilled water was first boiled. Condition 1 served as the control, so other than the light-scattering agent (described below), nothing was added. Condition 2 was made with 10 g of white table sugar to 400 g of just-off-boil distilled water (yielding a calculated Brix of 2.43% and measured TDS of 1.97% [average between Atago and VST]). Condition 3 was made with 10 g of instant coffee to 400 g of just-off-boil distilled water (yielding a measured TDS of 2.215% [average between Atago and VST]). Condition 4 was made of 57.17 g of coffee brewed to yield a final beverage mass of 400 g (yielding a coffee TDS 1.585% [average between Atago and VST]). Each solution was covered and left to cool overnight (temperature was recorded for the night—maintaining just under 25°C).
Solutions were then divided into eight (8) 50 g containers, with each container labeled 1 through 8. Container #1 as used as the baseline, with nothing added. In container #2, 0.1 g of TiO2 (yielding a concentration of 0.2%) was added. In container #3, 0.25 g of TiO2 (0.5%) was added. In container #4, 0.5 g of TiO2 (1.0%) was added. In container #5, 1 g of TiO2 (2.0%) was added. In container #6, 2 g of TiO2 (3.8%) was added. In container #7, 4 g of TiO2 (7.4%) was added. In container #8, 8 g of TiO2 (13.8%) was added. This created 32 total containers (8 per solution), with 28 of them having varying amounts of TiO2.
Before a 2 ml sample was drawn from a container, the solution was always stirred. Samples were drawn with and without the use of a VST syringe filter and place into dedicated sample ramekins. Refractometers were cleaned thoroughly, first with demineralized water, and then with alcohol pads between each reading.
Results
Data was stripped of identifiers related to solution, refractometer, and condition order (filter/no filter), and matched with a key after results. The data set was then checked for violations of assumptions for generalized linear model/ANOVA. A mixed model ANOVA was then run using the between variables of refractometer (Atago/VST) and solution (distilled, sucrose, instant, brewed), as well as within variables of condition (filter/no filter), sample (TiO2 concentration). Significant main effects were observed with solution (F3,119=91.05, p=0.00), condition (F3,119=75.83 p=0.00), and sample (F1,119=17.32, p=0.00). No significant differences were found between refractometers. A significant interaction was observed between sample and solution (p=0.01). Data was collapsed across refractometer for further analyses.
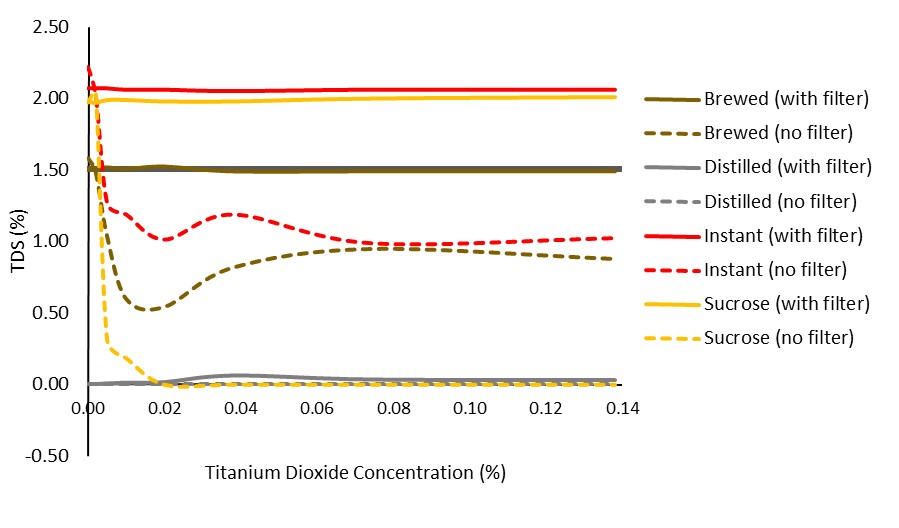
Figure 1. Impact of VST syringe filters in various solutions across varying amounts of TiO2.
It is clear that the filters allowed for a more consistent reading (improved precision). It is not clear, however, if they aided in a more accurate reading. To look at the data another way, we averaged the TDS reading for each solution, highlighting the filters’ ability to block added noise (i.e., reduce standard deviation):
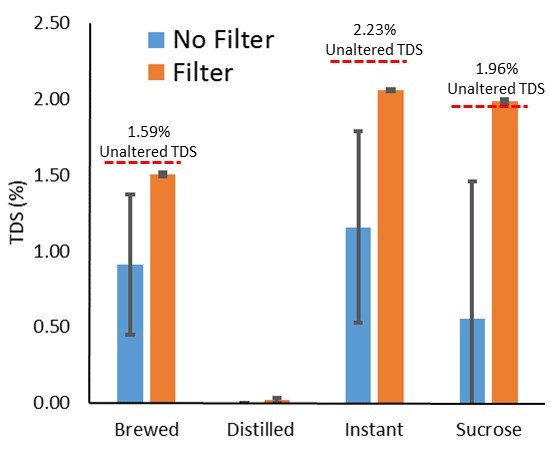
Figure 2. Collapsed across TiO2, demonstrating syringe filters reducing reading variability.
The above figure shows a significant effect of filtering on reducing noise in the sample/variability in the reading. One note is the slight reduction in readings seen only when coffee solubles were present in a solution (instant or brewed). This is evident at the 0.0% TiO2 level, but remains as TiO2 level increases.
Further, we did notice readings appeared in the distilled only solution after filtering (a slight increase is also seen in the filtered sucrose solution). Because of this, we did a simple elution (rinsing) experiment described in the Conclusions section.
(Raw data can be downloaded in a tab delimited text file here. As always, while we offer the data for your personal use, we kindly ask that you send a message to info@socraticcoffee.com before posting or presenting it in any public forum and attach appropriate acknowledgement.)
Conclusions
The main finding of this study is that the VST filters produced consistent results from solutions, even with increasing noise. It is worth noting that the levels of noise created by the TiO2 most likely far exceeded that found normally in coffee/espresso. Further, coffee, whether instant or brewed, regularly demonstrated a decrease in TDS after passing through a filter. This is evident even at the 0.0% TiO2 level, suggesting, as our previous work has, that the VST syringe filters remove some amount of dissolved solid content. It is also worth noting that the effect of the TiO2 on TDS with filtering was not consistent for all solutions (that is the significant interaction effect observed of Solution x Sample). Some, but not total removal, may suggest particle size variability in the TiO2 used, potentially exceeding the pore size of the filters. Further, to explain the differing effects of TiO2 on the various solutions, we propose two processes that may be occurring:
- Change in the refractive index of TiO2: Coffee solubles may be getting absorbed to the TiO2 particles, coating them and thereby reducing transmission of light through the particles. This would imply the particles become more opaque and the TiO2’s high RI is no longer able to effectively scatter light.
- Scatter/diffraction: As more TiO2 is added, perhaps the coffee components coating the TiO2 particles are titrated out. Coated particles may be aggregating and presenting a high level of light attenuation as well as scatter.
Small Elution Study
To more closely examine the possibility that the VST filters release something into a sample which may register as a dissolved solid, we pushed equal amounts of 90°C distilled water through new VST syringe filters twice (2 ml each time), capturing each “rinse” of the filter in its own container (the “eluted” sample). The liquid was allowed to cool to room temperature before measurement. Besides the two previously mentioned refractometers, we also included the Atago RX007α. This table summarizes our observations (5 samples per average). It appears the VST filters release some particulates into the sample which register as dissolved solids (i.e., positive TDS readings with distilled water only).
| Distilled Water | |||
| No Filter | Rinse #1 | Rinse #2 | |
| Refractometer | Avg (SD) | Avg (SD) | Avg (SD) |
| Atago PAL-COFFEE | 0.0 (0.0) | 0.0 (0.0) | 0.0 (0.0) |
| VST LAB Coffee III | 0.0 (0.0) | 0.014 (0.01) | 0.01 (0.00) |
| Atago RX007α | 0.0 (0.0) | 0.00272 (0.002) | 0.00484 (0.000) |
The above readings should all be 0.00. It is evident the VST syringe filters release something into the sample which registers as a dissolved solid by at least two of the refractometers. The lower reading of the Atago RX007α may be due to a limitation in our refractive index-to-coffee TDS conversion.
We then repeated this experiment but used two strengths of instant coffee (one near espresso strength, 8.4% TDS, and one near filter brewed coffee strength, 1.28% TDS). Instant coffee claims to be 100% dissolvable solids, which would mean it, theoretically, would not be affected by 2 µm filtering/VST syringe filters. Non-filtered readings were taken, then filtered readings, and then readings from the resultant solution when the used filters were eluted. This table summarizes our observations (5 samples per average).
| Instant Espresso Strength | |||
| No Filter | Filtered Sample | Eluted Sample | |
| Refractometer | Avg (SD) | Avg (SD) | Avg (SD) |
| Atago PAL-COFFEE | 8.4 (0.01) | 8.35 (0.07) | 7.09 (0.58) |
| VST LAB Coffee III | 8.4 (0.01) | 8.28 (0.06) | 7.12 (0.58) |
| Atago RX007α | Out of Range | Out of Range | Out of Range |
With the high sensitivity of the Atago RX007α, values in the “espresso range” exceeded its specifications for upper refractive index limit.
| Instant Filter Strength | |||
| No Filter | Filtered Sample | Eluted Sample | |
| Refractometer | Avg (SD) | Avg (SD) | Avg (SD) |
| Atago PAL-COFFEE | 1.32 (0.01) | 1.31 (0.01) | 0.56 (0.07) |
| VST LAB Coffee III | 1.25 (0.02) | 1.31 (0.01) | 0.56 (0.05) |
| Atago RX007α | 1.53525 | 1.32142 (0.0052) | 0.58181 (0.0563) |
Again, the differing coffee TDS values between the Atago RX007α and VST LAB Coffee III may be due more to our conversion. We cannot use this data to determine the accuracy of one device over the other (even though the Atago RX007α is stated by the manufacturer to be much more sensitive to changes in refractive index than the VST LAB Coffee III). The more important point here is that the filters, in the brewed coffee strength instant coffee, reduce coffee soluble content as a sample passes through in two of the three refractometers tested. These solubles can then be released from the filters via elution, which can also be quantified. To more clearly demonstrate this finding, dehydration of a filter after a sample has passed through should be performed. It is also unknown how much of the released solubles are from the filter itself and how much came from the solution. With the VST LAB Coffee III readings increasing post-filter, we believe it may point to a correction factor in the device’s detection algorithm. Further, because lipids would not be present in instant coffee, the deviation may also reflect some algorithm-based correction for their expected presence in the VST refractometer.
Claim tested: Particulate matter skews refractometer readings, and VST syringe filters remove it. Equipment tested: VST syringe filters, Atago PAL-COFFEE, Atago RX-007α, VST LAB Coffee III.
Socratic Coffee (2016). Examining the Impact of Particulate Matter in Refractometry for Coffee Assessment. Study No. 8. socraticcoffee.com/2016/02/examining-the-impact-of-particulate-matter-in-refractometry-for-coffee-assessment/