Measuring Total Dissolved Solids: A Refractometer Comparison (Part III — Espresso & Filters)
For espresso, the Atago PAL-COFFEE, VST LAB II and VST LAB III measured TDS comparably. The Atago gave the tightest repeat readings.
- Equipment tested
- Atago PAL-COFFEE, VST LAB Coffee II, VST LAB Coffee III, VST syringe filters
Posted: 02 Jul 15
*Updated: 08 Mar 16
*
Abstract
Continuing with series on refractometer comparisons, the goal of this study was to examine the measurements from three refractometers advertised to measure the total dissolved solids (TDS) content of espresso. As a secondary goal, this study aimed to assess the impact of the VST syringe filters on TDS readings in espresso. In a single experiment, the VST LAB Coffee II Coffee & Espresso Refractometer, VST LAB Coffee III Refractometer, and Atago PAL-COFFEE Refractometer were compared with a total of 12 samples (3 readings per sample) for each device. Testing procedures followed the VST recommended guidelines. No significant difference was found between the devices. The use of the VST sample filter did have a significant effect on TDS reading (p=0.00); however, the effect did not differ for the three devices.
Disclosures
We have no vested interest in any of the products being tested.
Authors
Jeremy and Joe
Introduction
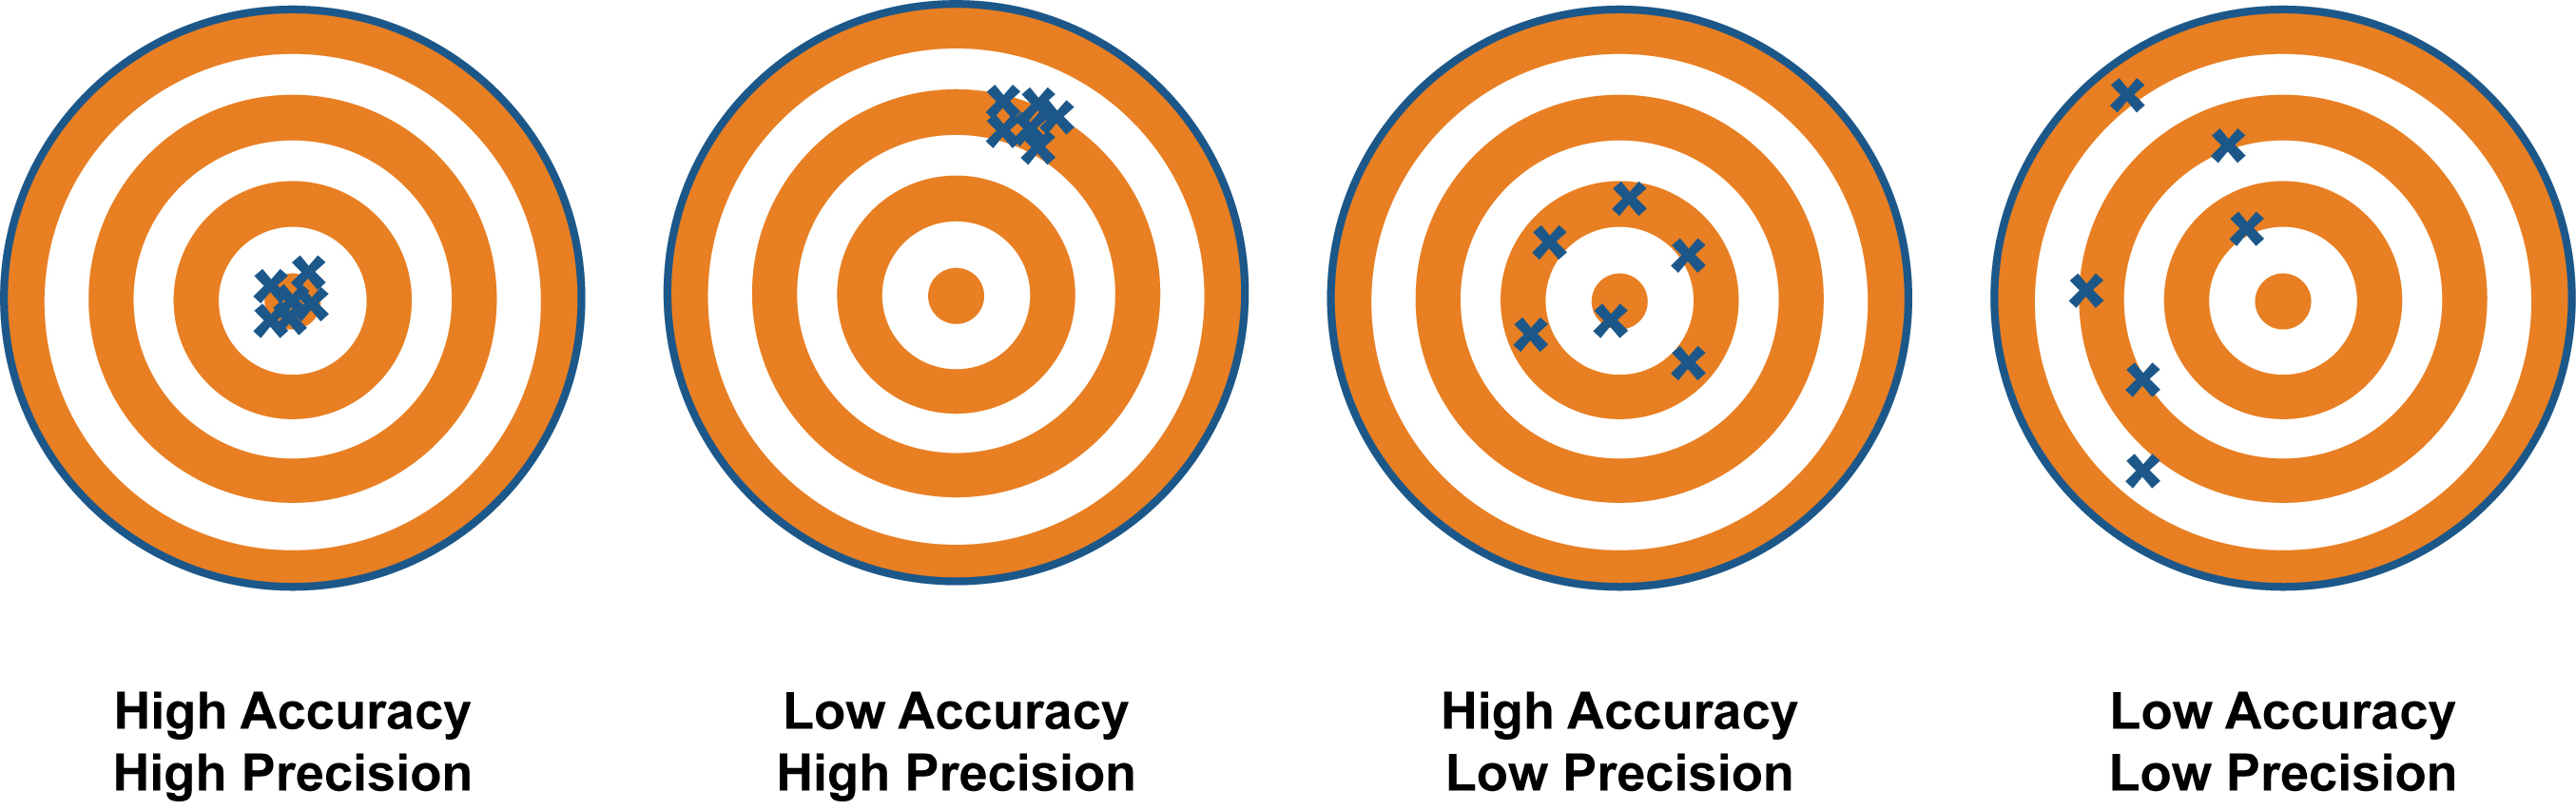
We set out to test the performance of three devices compared against each other, not necessarily assess their individual precision or accuracy against stated manufacturer specifications. However, there were components of precision assessed in the current study design. Precision is a measure of how well a result can be determined–the degree of consistency and agreement among measurements of the same quantity. It is important to remember that a measurement can be precise without being accurate (demonstrated in the graphic below).
Methods
The VST devices used were the VST LAB Coffee III 4th Generation Refractometer (stated range: 0.00-20.00% TDS; TDS resolution 0.01%; precision +/-0.01%; accuracy from 0.00-4.99% of +/- 0.03% and from 5.00-20.00% of +/-0.05%; temperature range of 15-40C) and the LAB Coffee II (Coffee & Espresso) Refractometer (stated range: 0.00-20.00% TDS; TDS resolution 0.01%; precision +/- 0.03%; accuracy from 0.00-4.99% of +- 0.05% and from 5.00-20.00% of 0.10%; temperature range of 15-40C). The Atago device was the PAL-COFFEE (stated range: 0.00-22.00% TDS; TDS resolution 0.01%; accuracy in Brix of 0.10; temperature range of 10-100C; temperature resolution 0.1C). We recommend checking the companies’ sites for more information regarding device specifications. All refractometers were loaded with fresh batteries and, along with container of distilled water, placed on the test bench the night before to allow temperature to equilibrate to ambient room temperature (25C). Distilled water, using a conductivity-based TDS meter, contained 0 ppm and was used to zero all devices.
The coffee used for the experiment was Toby’s Estate Woolloomooloo blend. Coffee was rested for 10 days before use.
Equipment used:
- La Marzocco (LM) GS/3 MP (mechanical paddle), single group fitted with 0.6mm restrictor and a naked portafilter with the original LM basket, set at 9 bar water pressure (verified with a Scace II); brewing temperature 92.5 degrees C regulated with a PID on board
- Water filter used for the experiment was Brita Purity C150 Quell ST
- Victoria Arduino Mythos One coffee grinder
- Two scales (Ohaus to measure the dry coffee dose; AWS to measure the beverage mass)
- Pen and paper to record values
- FLIR thermal camera
- 12 (for each condition) empty ramequin bowl for measuring the mass of the shot
- 12 (for each each condition) ceramic/glass cups for TDS measurement
- Smart Tamp tamper to standardize the pressure applied to the coffee
- Atago PAL-COFFEE refractometer
- VST LAB II refractometer
- VST LAB III 4th Generation refractometer
- VST syringes
- Distilled water
- Alcohol pads
- Pipettes
- Serviettes
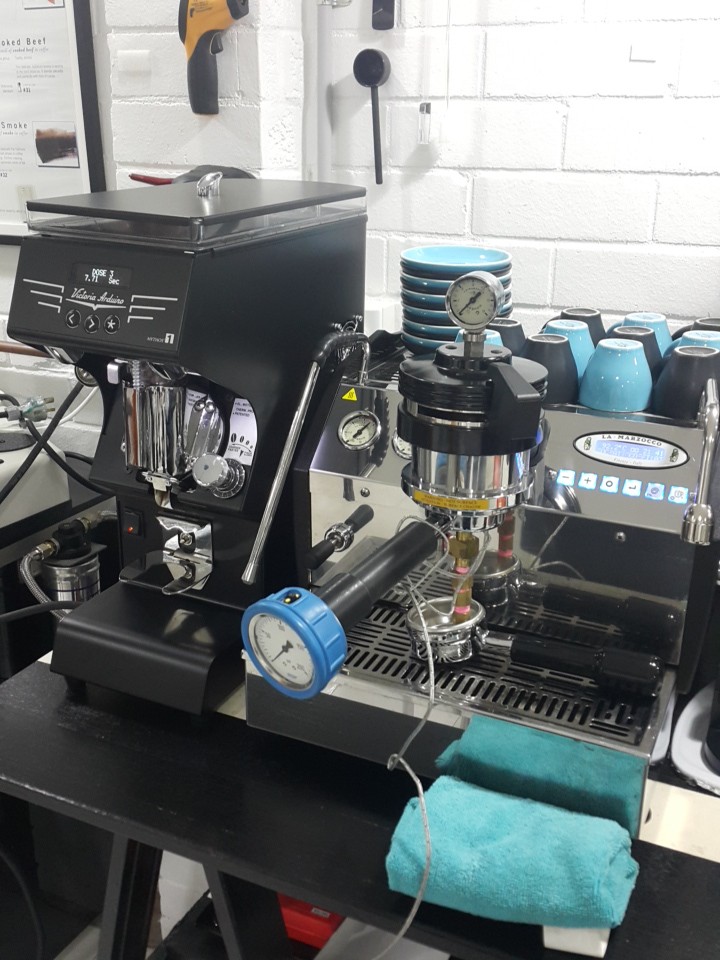
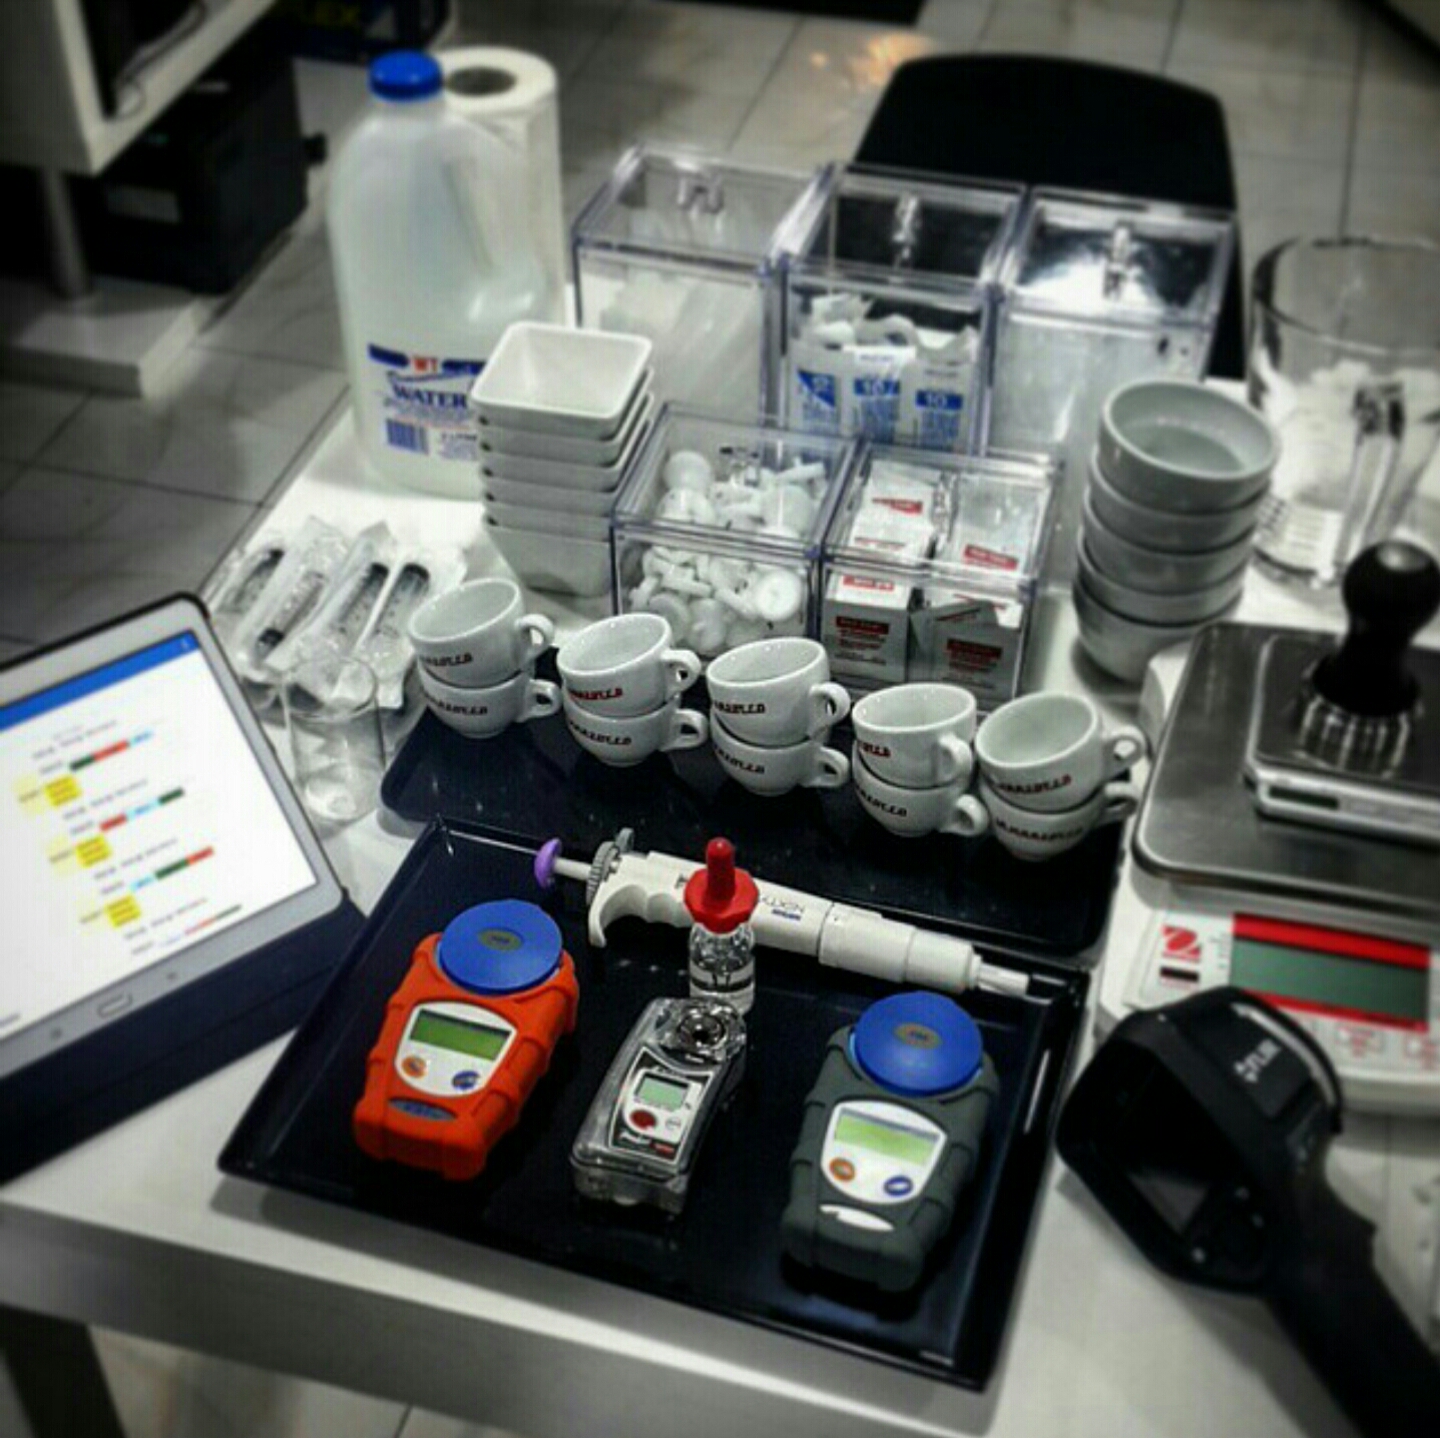
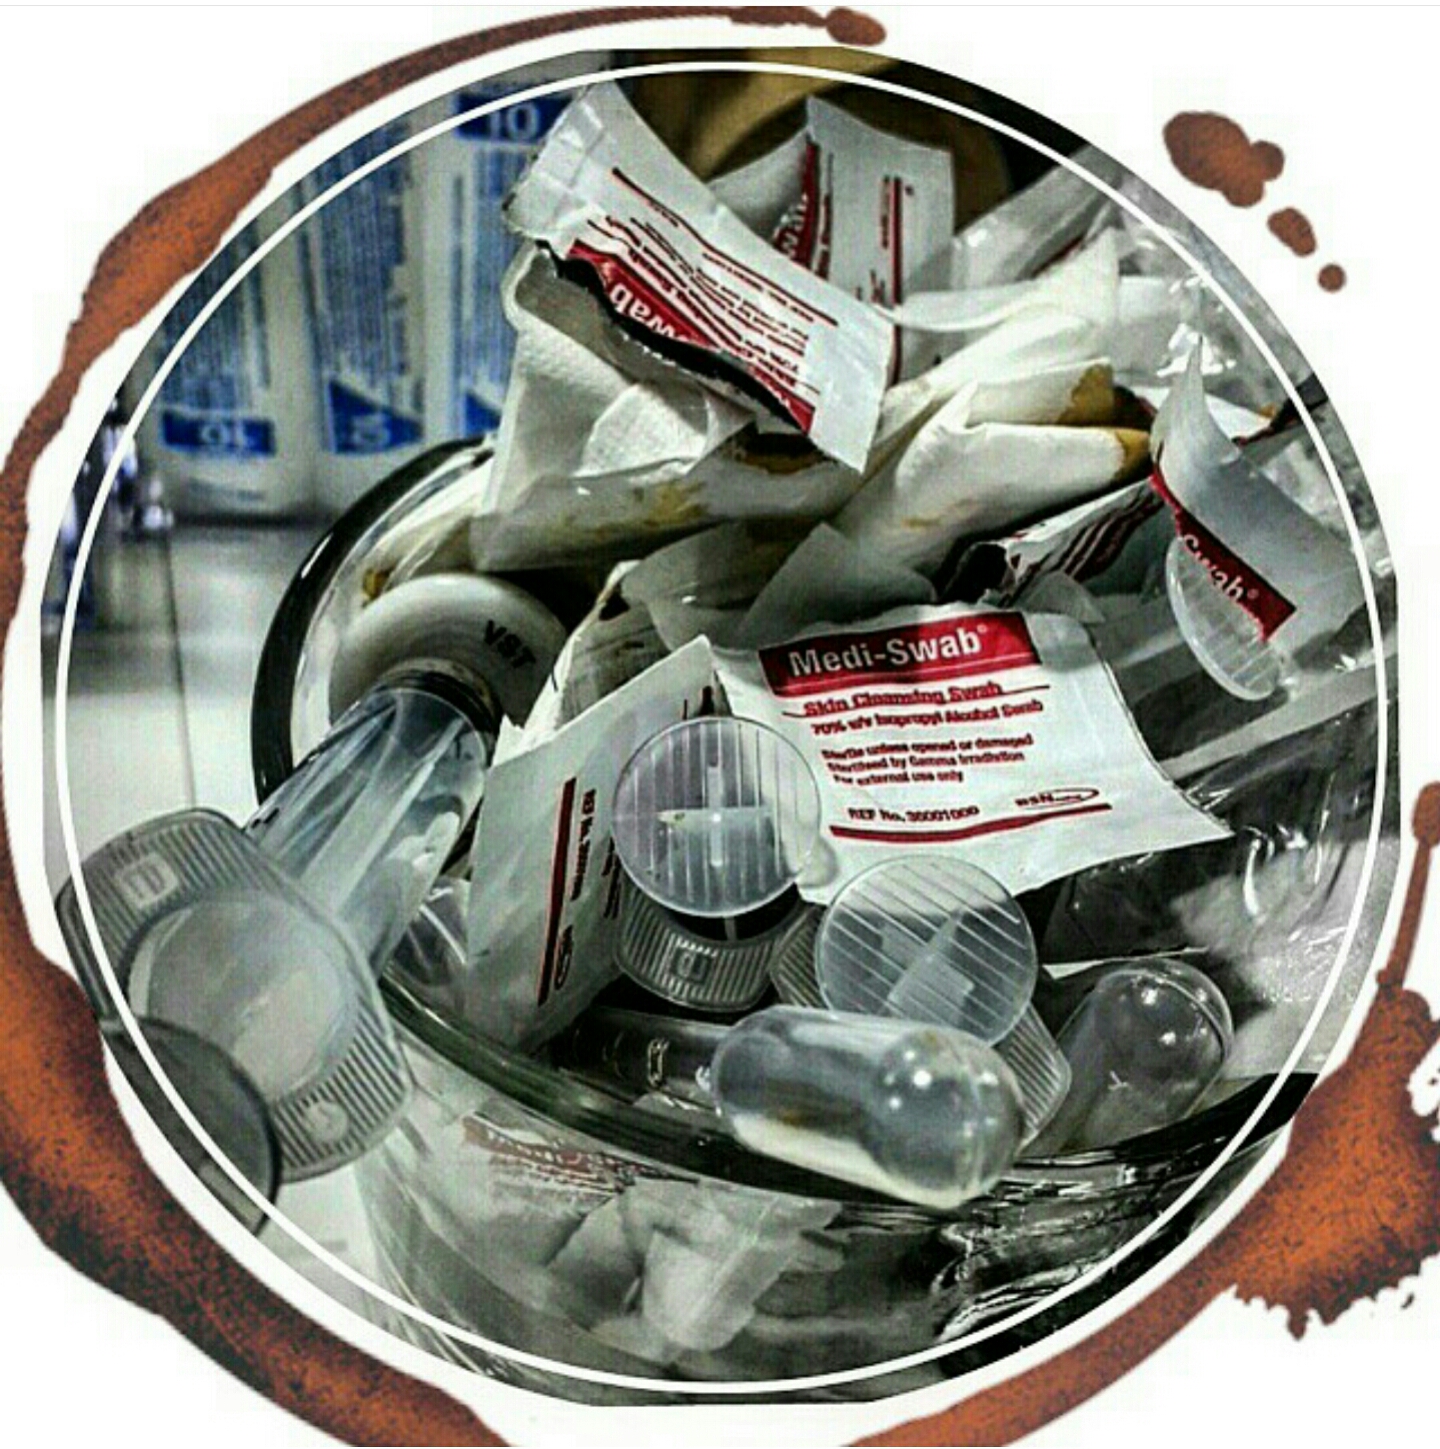
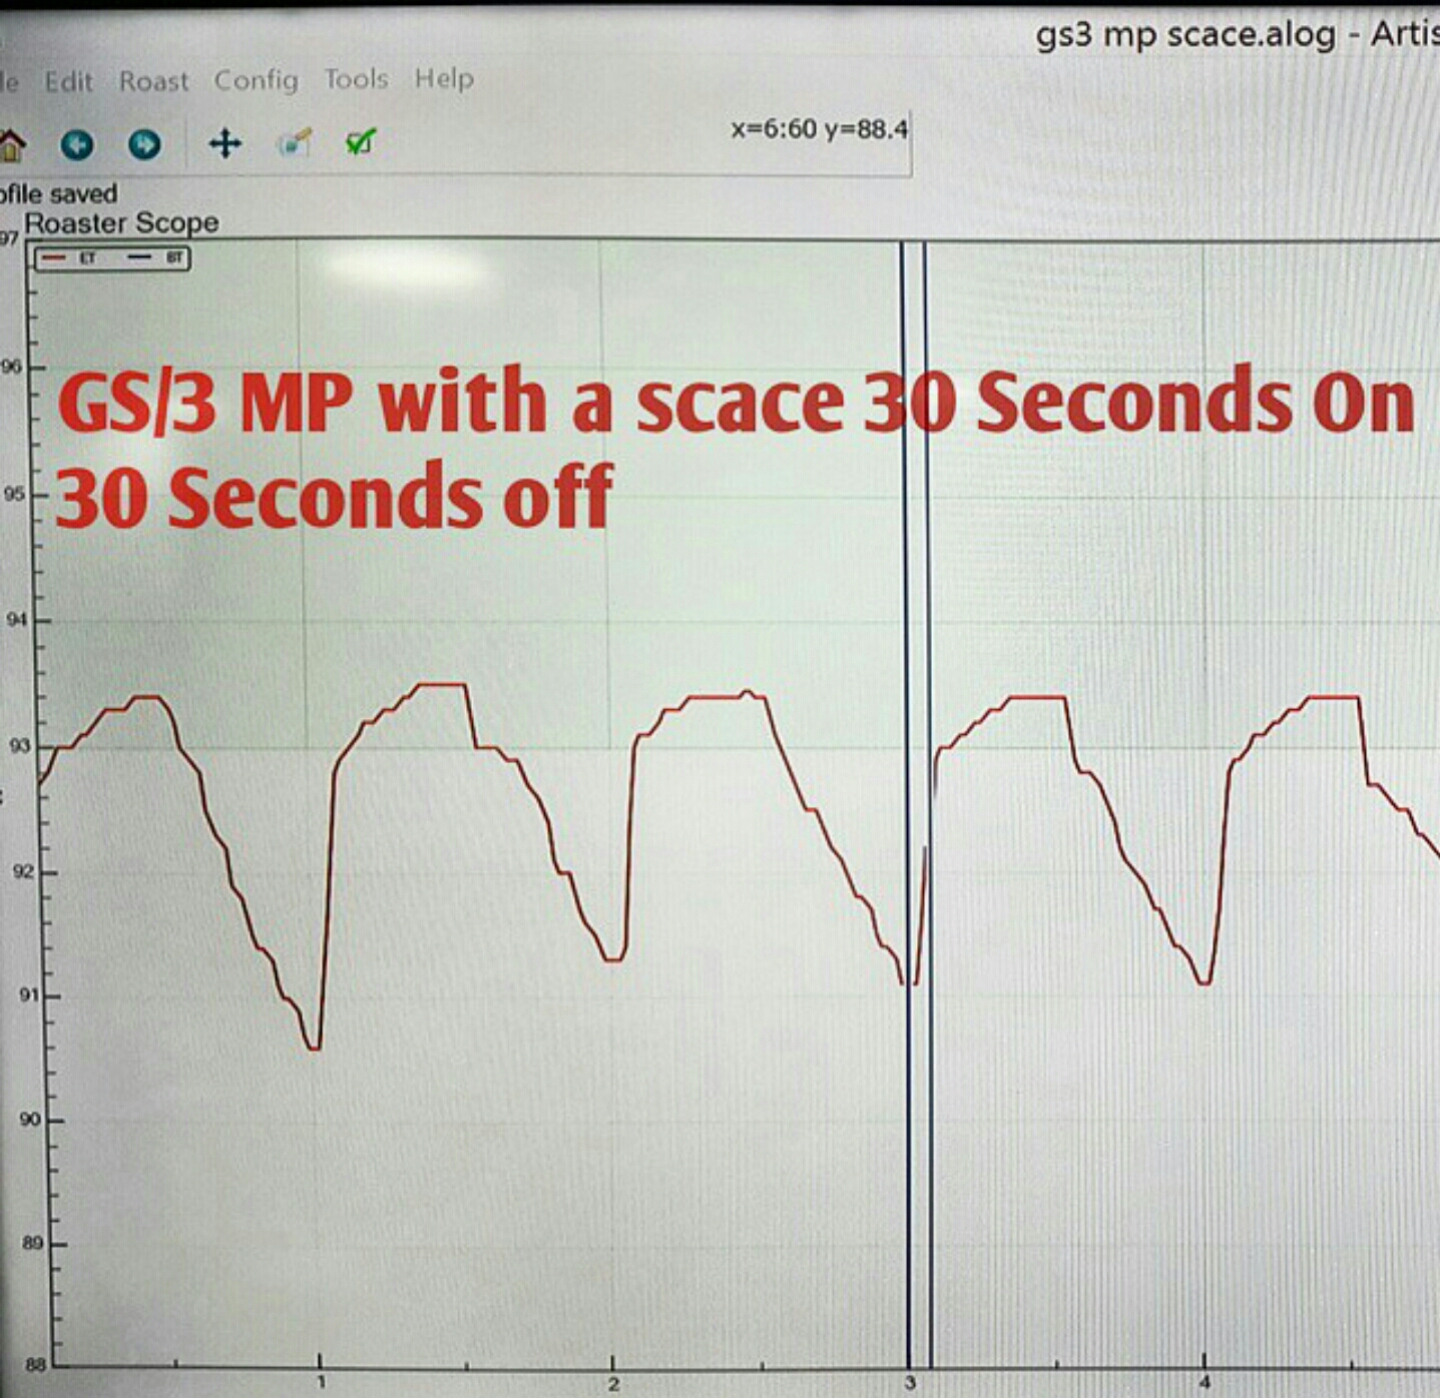
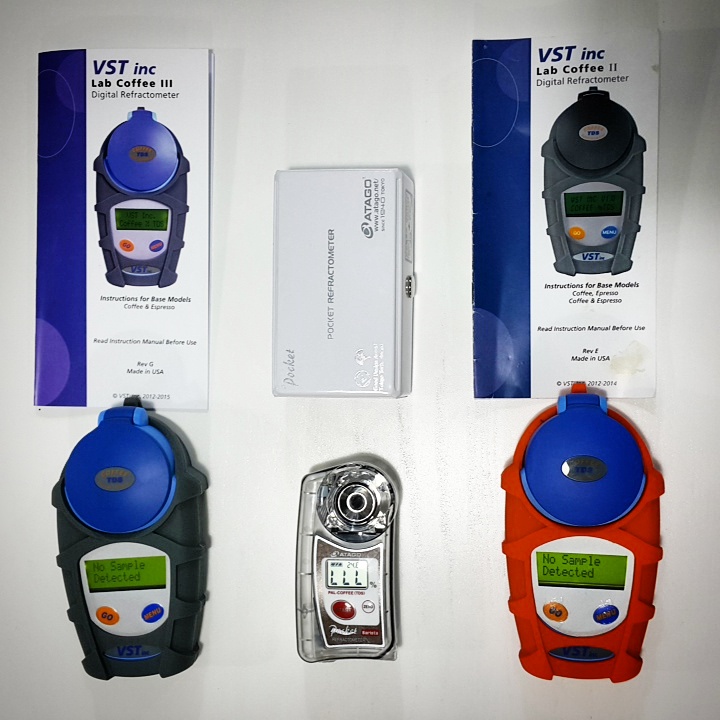
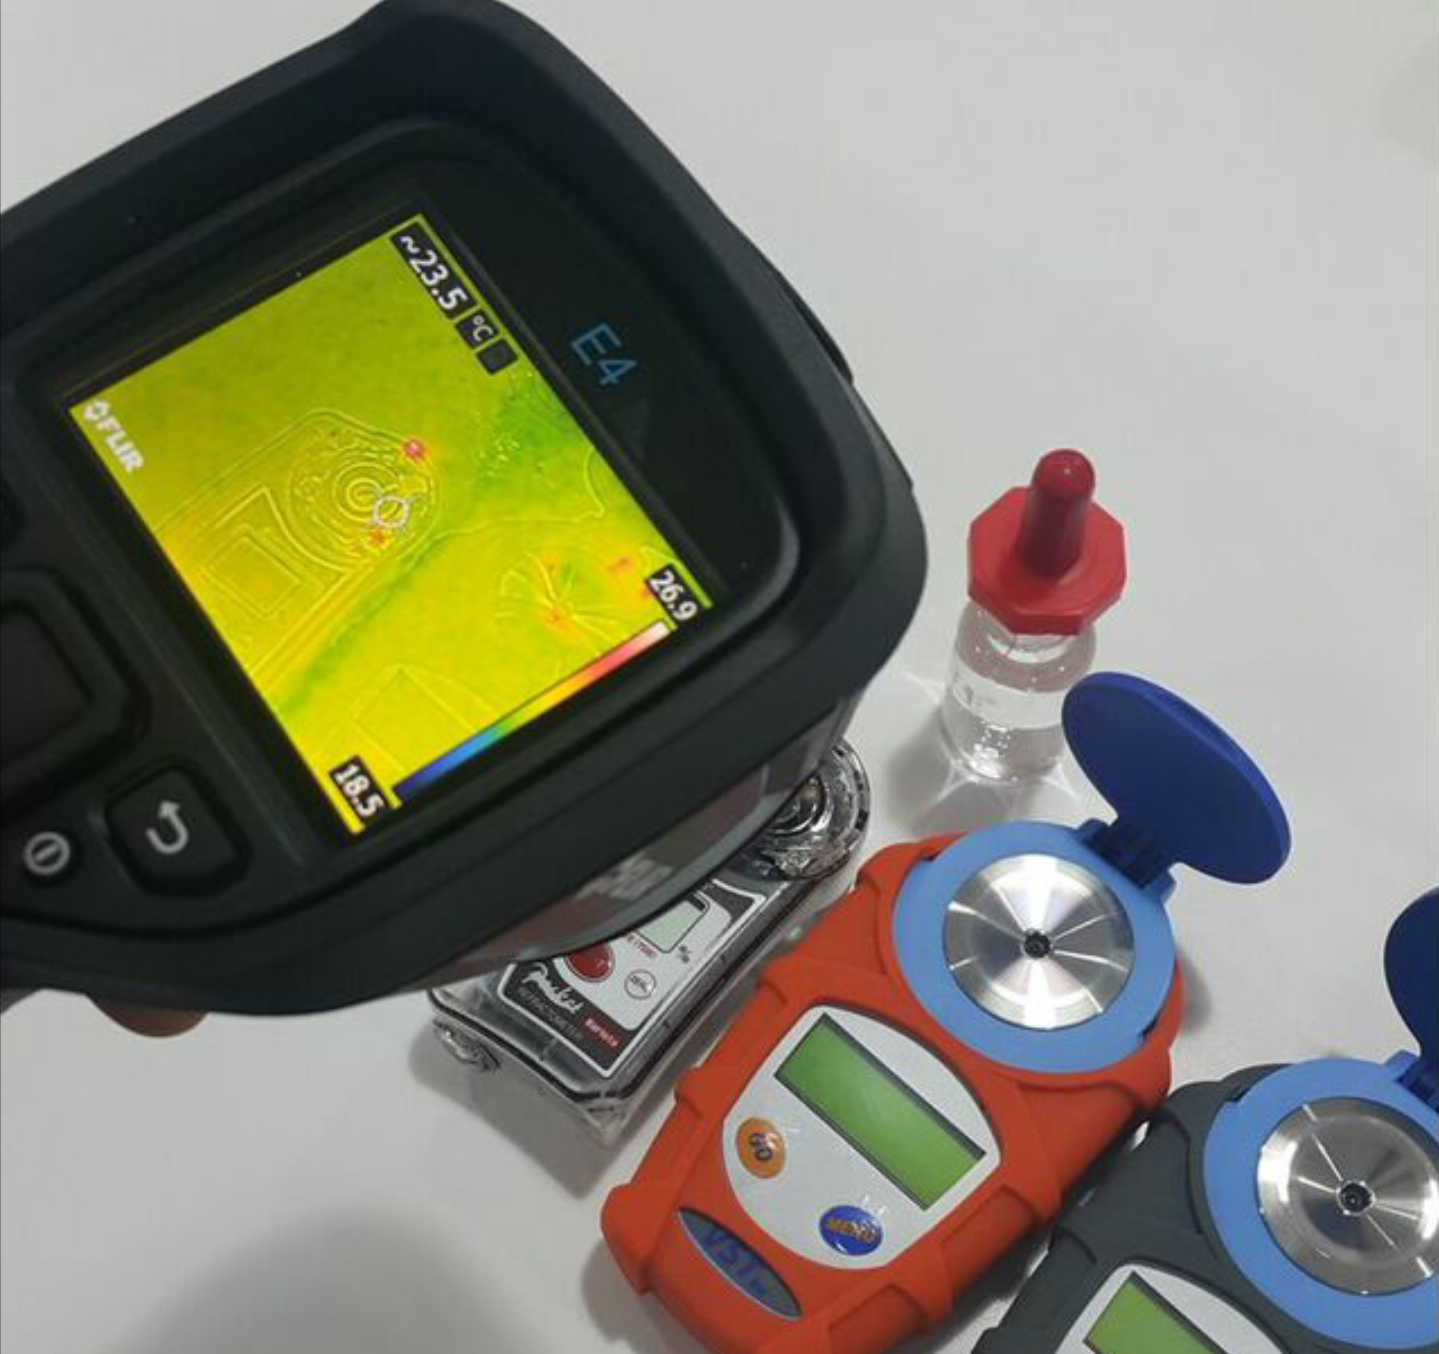
Experiment was carried out over 4 hours. The conditions with the grinder, espresso machine, and coffee tamper used were kept constant for both conditions. The blades were warmed up by grinding 500g of coffee beans. The room temperature was controlled with air conditioning at approximately 23-25 degrees Celsius for the experiment.
A brew ratio of 1g coffee to 2g brew weight was used (i.e., 20g dose for 40g final beverage mass). A total of 6 shots were pulled for each condition (“Filter/No Filter”)
Zeroing preparation of the refractometers was performed identically for both conditions.
- Prior to all measurements, the refractometers were set at room temperature together with the distilled water (a common practice we use).
- All refractometers were zeroed and cleaned prior to the coffee extraction.
- The water temperature for zeroing was between 15-30°C (as recommended by VST).
Filtering procedure for all coffees was carried out according to VST instructions.
- For each shot, we allowed the espresso to cool for 1 minute and the sample was stirred for 5 seconds.
- For each espresso, 4ml of espresso was drawn up using a syringe tip (placed under the crema and without touching the bottom), followed by attaching a VST syringe filter (for one condition; no filter for the other condition) and slowly dispensing it into a clean ceramic cup. The sample was then given approximately 45 seconds to cool down.
Sampling procedure for all coffees was carried out according to VST instructions.
With a clean pipette, we drew a sample large enough to dispense in all three refractometers. This sample was transferred to a clean, dry cup and allowed to cool for an additional 30 seconds (the temperature of the sample was checked with the thermal camera). Another fresh pipette was then used to siphon the cooled espresso sample and transfer it to the refractometer wells. The coffee sample was allowed 25 seconds to equilibrate in the well of the refractometer before recording. Three total readings were taken for each sample per device, each one minute apart.
Results
A mixed design was used to analyze the data from this study (using R 3.1.1 and SPSS 19.0.0). Twelve total samples were measured. Between variables were condition (VST filter, No Filter) and device (Atago, VST LAB II, VST LAB III). Within variables were sample number (6 per condition) and reading number (3 per sample). Order of the samples being placed on the refractometers was randomised to include all possible permutations.
The three main hypotheses were 1) the Atago PAL-COFFEE, VST LAB II, and VST LAB III would give significantly different TDS readings for the same sample of coffee, 2) samples using the VST syringe filters would have significantly different TDS readings compared to the TDS readings of samples without the VST syringe filters, and 3) there would be a significant interaction between the TDS readings of the refractometers dependent on the use of the VST syringe filters.
No statistically significant effect was seen for sample order (p = 0.97). To assess the first two hypotheses, an analysis of variance (ANOVA) was run, with between-subjects variables of condition (Filter Sample, No Filter Sample) and device (Atago, VST II, VST III). No effects were found for condition (F(1,102) = 0.56, p = 0.46), device (F(2,102) = 0.06, p = 0.94), or the interaction of condition and device (F(2,102) = 0.03, p = 0.97).
Out of curiosity, we examined the average standard deviation of multiple readings within a sample (i.e., a reading of each sample was taken every minute for three minutes with each device). This test-retest reliability (also referred to as repeatability) produced some interesting results (see Table 1). An ANOVA demonstrated a significant difference in the no filter condition (F(2,15) = 3.68, p = 0.04). Post-hoc t-tests revealed that use of a filter did impact readings for the VST devices significantly (p = 0.02 or less), but not the Atago (p = 0.30). Within a condition, t-tests revealed significant differences in the repeatability measurements only between the Atago-No Filter and VST II-No Filter (p = 0.049).
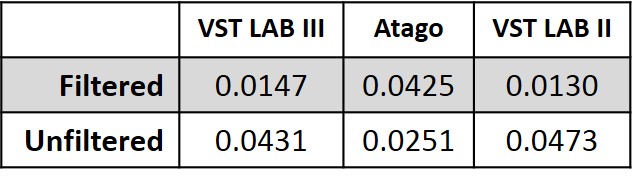
(Raw data can be downloaded in a tab delimited text file here. As always, while we offer the data for your personal use, we kindly ask that you send a message to socraticcoffee@gmail.com before posting or presenting it in any public forum and attach appropriate acknowledgement.)
Conclusions
Overall, the VST and Atago devices performed comparably. The only significant results we observed were in the test-retest reliability standard deviations, where the Atago had consistently tighter precision in its cluster of readings compared to the VST LAB II (p = 0.07 compared to the VST LAB III) in the unfiltered sample condition.
While we did not assess accuracy of the devices against a true or accepted value, there is some indication, given the lack of consistent statistical difference in their measurements, that each device is measuring comparably to the others–and this is perhaps even more so the case with the Atago and VST LAB III. Technically, our conclusion is that we fail to reject the null hypothesis–or, that we fail to reject that the espresso TDS measurements of the Atago, VST LAB II, and VST LAB III are statistically the same. Notice this is slightly different than saying the results are the same. Perhaps, for instance, given 100 samples per device, we would see regression to the true means and a statistical significance would emerge. But it is also helpful to look at findings over multiple studies. Looking at our previous posts (here and here), some significant differences between devices were noted. These differences were seen in the assessment of brewed coffee, commonly thought to require finer resolution for a device than espresso TDS assessment. Though the measurements were statistically significant, you should ask yourself whether or not the measurement differences are meaningful to you, whether or not they fall within the stated device tolerances, etc. To refer to the earlier accuracy v. precision graphic, we have been testing these devices in multiple studies with an unknown bullseye. The below figure is meant to represent a simplified generalization of our findings:
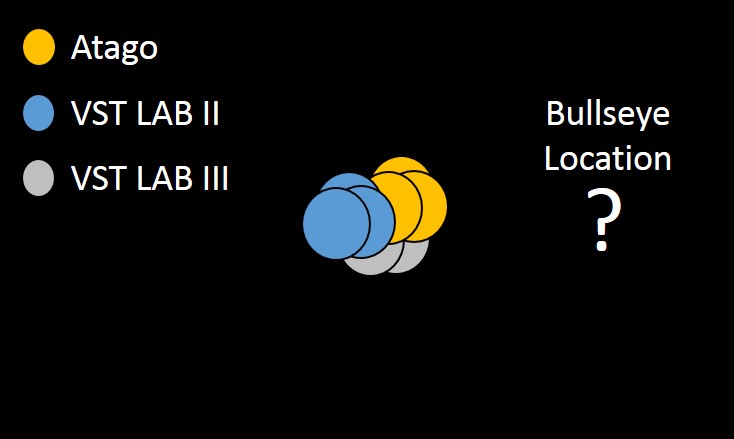
We do not necessarily know what these devices should be measuring (i.e., accuracy), but we can say that there has been little-to-no statistically significant difference in their readings. If one of these devices claims high accuracy and the measurements of other devices are not statistically different from that device, what can you conclude? If one device claims to measure things another device does not (e.g., “total dissolved solids” versus “total brew solids”), yet their measurements are not statistically different, what can you conclude? Clearly, testing of additional devices from the manufacturers would be ideal, as it is possible one or more devices we tested was an anomaly.
While many elaborate explanations could potentially explain our results, we remind you to consider Occam’s razor. There are an infinite number of possible and more complex alternative explanations; however, simpler theories and explanations, which are better tested and more falsifiable, should be preferred. This is the first open, unbiased methodical and well-controlled comparison of these devices that we are aware of. While others may claim different results, we welcome them to share their methods and data with everyone so that you, the reader, may decide for yourself.
Bottom line: Any of these devices, particularly the Atago or VST Lab III, should do an adequate job at determining the TDS of your coffee/espresso. Also, maybe reconsider whether or not you really need to filter your espresso samples.
Equipment tested: Atago PAL-COFFEE, VST LAB Coffee II, VST LAB Coffee III, VST syringe filters. Also used: La Marzocco GS/3 MP, Brita Purity C150 Quell ST, Victoria Arduino Mythos One, Smart Tamp, Ohaus lab scales, AWS scale, Scace II.
Socratic Coffee (2015). Measuring Total Dissolved Solids: A Refractometer Comparison (Part III — Espresso & Filters). Study No. 5. socraticcoffee.com/2015/07/measuring-total-dissolved-solids-a-refractometer-comparison-part-iii-espresso-filters/