Initially posted: 01 Jun 16
Abstract
This study had two goals: 1) explore the impact of uniform particle size on espresso extraction; 2) explore the impact of particle stratification on espresso extraction. The dependent variables collected were shot time and TDS. Coffee particles were stratified into two ranges: 177-250 µm and 250-300 µm. Six conditions were tested with shots consisting of: 1) particles between 250-300 µm layered in the bottom half of the portafilter basket and particles 177-250 µm layered on the top; 2) particles between 177-250 µm layered in the bottom half of the portafilter basket and particles 250-300 µm layered on the top; 3) particles solely of 177-250 µm size; 4) particles solely of 250-300 µm size; 5) thoroughly mixed particles of 177-300 µm size; 6) standard shots (no particle manipulation). Results demonstrated significant effects of condition on TDS and shot time (p = 0.00).
Bottom line
Based on our data, given a standard espresso setup, particle size alone did not systematically predict espresso extraction (TDS/extraction yield). A larger range of particle size variability led to increased extraction. Further, particle size did significantly impact overall shot time (i.e., smaller particles led to longer extraction time); however, the placement of smaller particles within an espresso puck did not lead to significant differences in shot time or extraction.
Disclosures
We have no vested interest in any of the products being used for this experiment. STANDART was given exclusive initial publication of the write-up for this experiment (StandArt, 4th Edition, February 2016).
Authors
Jeremy, Joe, and Dave
Introduction
The impact of particle size and placement within an espresso puck is an active area of interest and debate for the coffee community. There are many high-end academic and industry labs investigating nuances related to the dynamics of fluids through an espresso puck (e.g., Corrochano et al., 2015). Our approach differs, however, as we asked ourselves two relatively simple questions and attempted to investigate them in a very applied, practical way: does the position of particles within a puck affect its extraction and does the uniformity of particle size affect espresso extraction.
Within the domains of basic and applied science, there is always a balance between internal and external validity. So while a more sophisticated approach can create an experimental environment of strong controls, potentially yielding detailed information on underlying mechanisms, the practicality and relatability of its methodology would be foreign to a coffee shop, barista, or consumer. Our approach is targeted on the applicability to a shop or individual, placing significantly greater value on the external validity of our findings.
The two main hypotheses were 1) controlled placement of particle sizes would lead to significant differences in extraction (“fines migration” hypothesis) and 2) more uniform particles would lead to significant differences in extraction (“unimodal distribution” hypothesis).
Methods
The coffee used for the experiment was a single origin washed Ethiopian Sidamo Guji. Coffee was rested for 12 days before use. The same batch of roasted coffee was used for the entire experiment. Room temperature was 25°C and humidity 65%.
Equipment used:
- La Marzocco (LM) GS/3 MP (mechanical paddle), single group fitted with 0.6mm restrictor and standard double portafilter with the 20g VST basket filter, set at 9 bar water pressure (verified with a Scace II); brewing temperature 94°C regulated with a PID on board
- Water filter used for the experiment was Brita Purity C150 Quell ST
- Mahlkönig EK43 coffee grinder (the same grind setting was used for all conditions)
- Two scales (Ohaus Navigator XL calibrated prior to the experiment to measure the dry coffee dose; Acaia Lunar calibrated prior to the experiment to measure the beverage mass)
- HG1 blind doser
- Pen and paper to record values
- 5 (for each condition) empty ramequin bowl for measuring the mass of the shot
- 5 (for each condition) ceramic/glass cups for TDS measurement
- Eazytamp 5 Star Pro tamper to standardize the levelness and axial compression of the coffee bed (verified at 3 kg of pressure)
- VST LAB III 4th Generation refractometer, zeroed according to manufacturer guidelines
- Distilled water
- Alcohol pads
- Infra-red gun to measure the solution prior to refractometer measurement (under 30°C degrees, average 27.5°C)
- Pipette/Serviettes
- Air Blower/Super Soft Microfiber towels
- Advantech Manufacturing DuraTap & 8” Half-Height Stainless Steel Test Sieves, consisting of:
- Cover
- US Std. Mesh Size No. 50 Sieve (300 µm)
- US Std. Mesh Size No. 60 Sieve (250 µm)
- US Std. Mesh Size No. 80 Sieve (177 µm)
- Bottom Pan
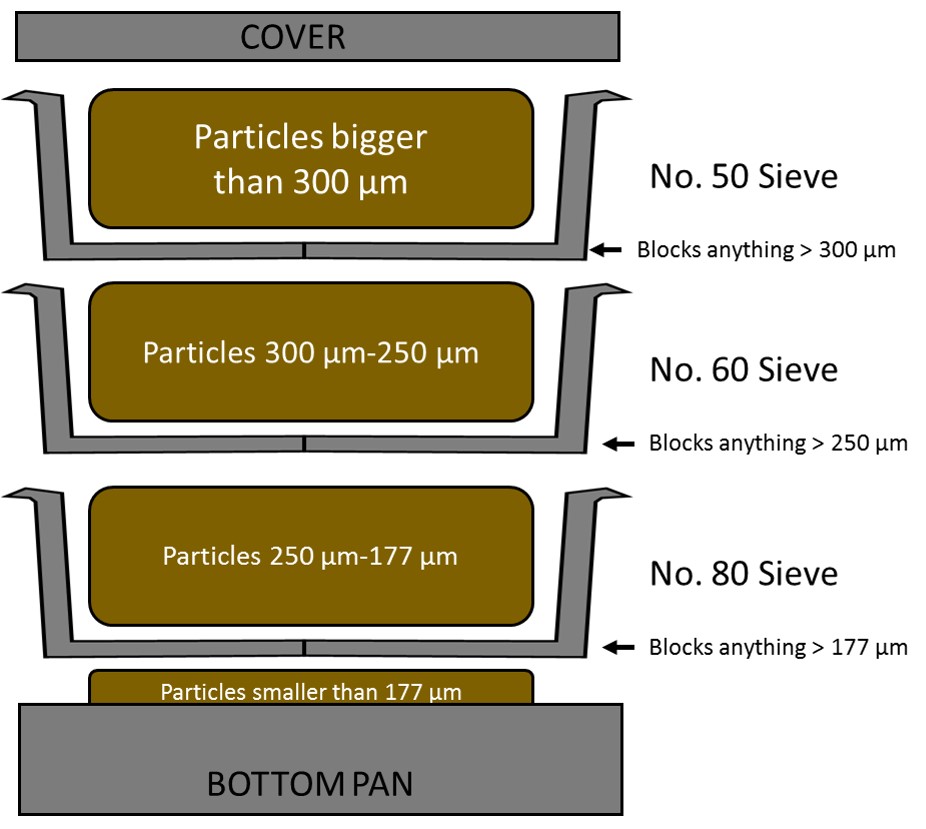
Figure 1. Sieve stack used for experiment.
The experiment was carried out over 8 hours. The sieve stack was assembled and loaded with 100 g of coffee ground from the EK43 in the No. 50 sieve. The DuraTap was then used to perform controlled shaking and tapping for 10 minutes, per the “optimized stack” protocol established by Socratic Coffee previously. This was repeated as needed to arrive at amounts of coffee required in the desired particle size ranges.
Six different particle conditions were tested, with 5 shots per condition.
Condition 1 – Layered puck with 10 g of particles in size range 177-250 µm on top and 10 g of particles in size range 250-300 µm on bottom.
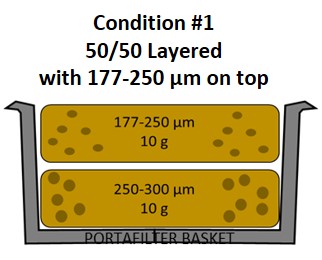
Figure 2. Condition 1 with the smaller particles placed on top of the puck.
Condition 2 – Layered with 10 g of particles in size range 250-300 µm on top and 10 g of particles in size range 177-250 µm on bottom.
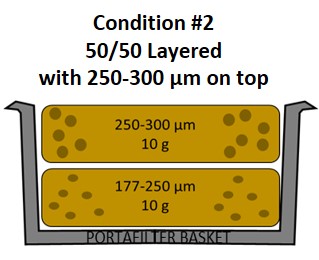
Figure 3. Condition 2 with the larger particles placed on top of the puck.
Condition 3 – 20 g of particles in size range 177-250 µm.
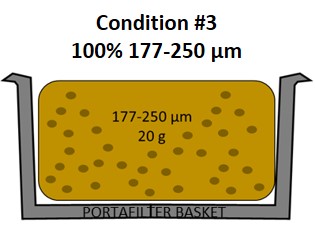
Figure 4. Condition 3 with uniform particles between 177-250 µm.
Condition 4 – 20 g of particles in size range 250-300 µm.
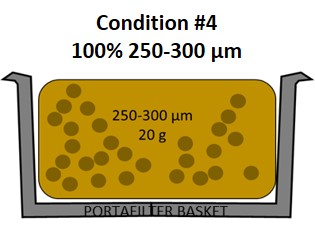
Figure 5. Condition 4 with uniform particles between 250-300 µm.
Condition 5 – 10 g of particles in size range 77-250 µm and 10 g of particles in size range 250-300 µm, all thoroughly mixed.
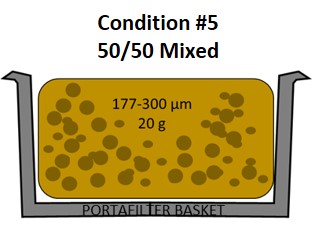
Figure 6. Condition 5 with two equal parts of stratified particles thoroughly mixed.
Condition 6 – Control condition with standard 20 g dose shots (no particle size manipulation).
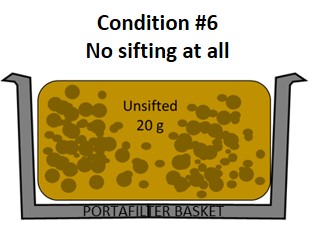
Figure 7. Condition 6 with completely unsifted particles.
The conditions with the grinder and espresso machine were constant for all conditions. The room temperature was controlled with air conditioning at approximately 25 °C for the duration of the experiment.
A brew ratio of 1g coffee to 2g brew weight was used (i.e., 20g dose for 40g final beverage mass). Because TDS is most strongly correlated with beverage mass, shots were all pulled to a consistent mass. Time to reach this weight was recorded. Shots were performed with 10 s pre-infusion before activating pump.
All TDS samples were performed following VST recommended guidelines.
Results
All analyses were performed using R 3.1.1 and Excel 2016. Data was first assessed to ensure it does not violate assumptions for multivariate analysis of variance (MANOVA). Beverage mass values between conditions were compared via t-tests. No significant beverage mass differences existed between conditions with the exception of the control condition. Variance in beverage mass for that condition was found to be much lower than the others. A MANOVA utilizing the Pillai test, with shot time and TDS as dependent variables, showed a significant effect of condition (overall: F(5,24)=4.76, p=0.00; shot time: F(5,24)=26.12, p=0.00; TDS: F(5,24)=2.95, p=0.03). More specific ANOVAs and t-tests were then utilized to better explore relationships in the data.
The below plot shows TDS values and shot times, clustered by condition.

Figure 8. Scatterplot of TDS values and shot times to reach 40 g beverage mass.
Extraction yield can be calculated simply as: (Beverage Mass x TDS)/Coffee Dose
Because our experiment controlled coffee dose and aimed for consistent beverage mass for all conditions, using extraction yield as a dependent variable did not yield significantly different results compared to using TDS (see Figure 9). As such, we completed all further analyses only with TDS.
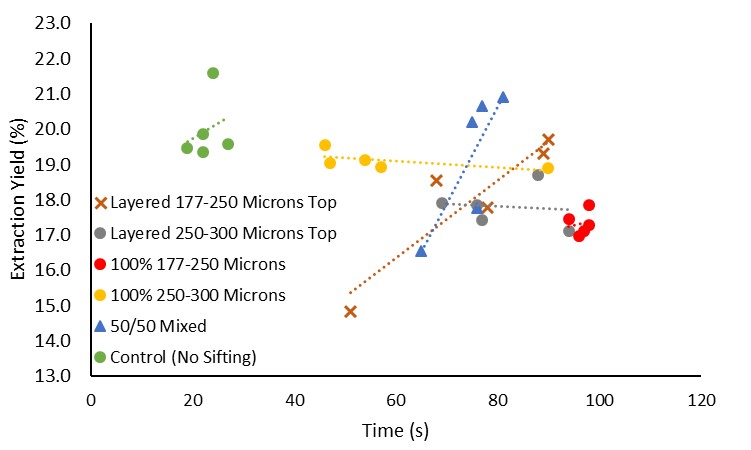
Figure 9. Scatterplot of extraction yield values and shot times to reach 40 g beverage mass.
Comparing the effects of particle layering (Conditions 1,2, & 5) on TDS (Figure 10) and shot time (Figure 11), demonstrated no significant effects (p=0.39 and p=0.66, respectively).
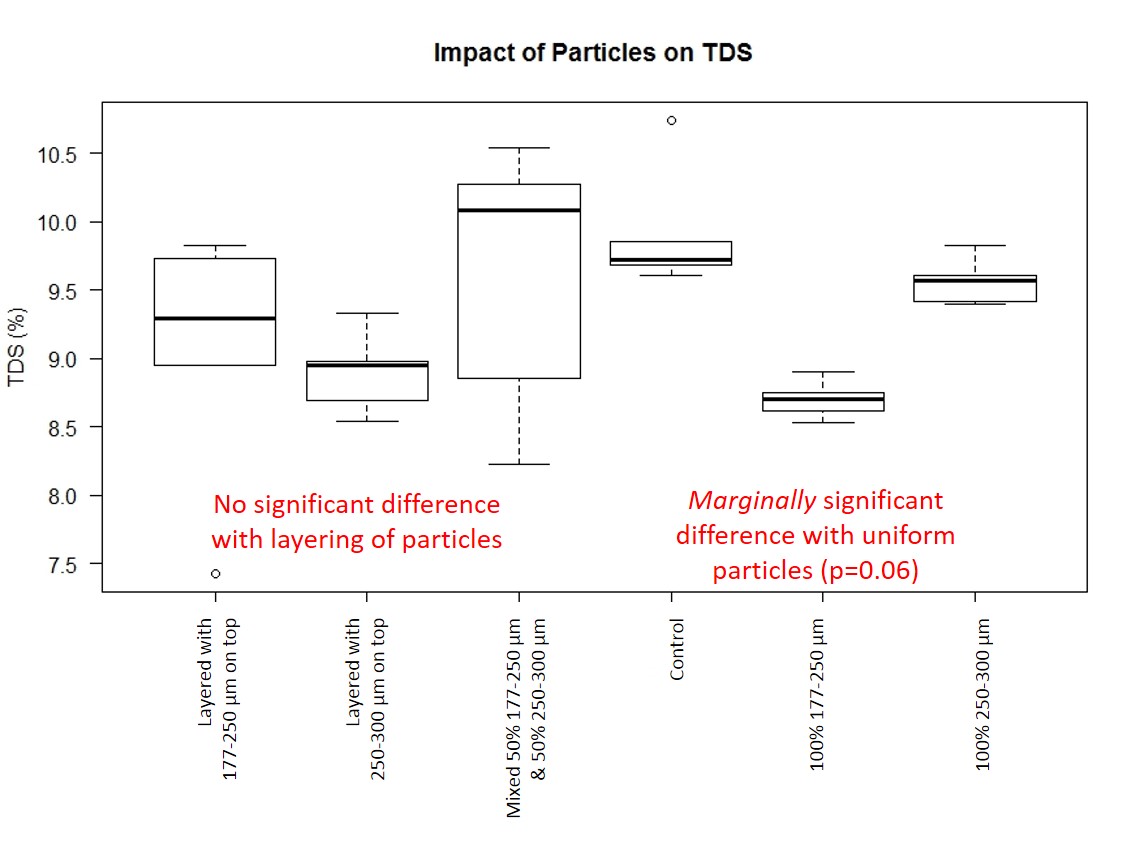
Figure 10. Boxplots showing the average with variability of TDS for shots in each condition.
Comparing the effects of particle uniformity and size (Conditions 3,4, & 6) on TDS (Figure 10) and shot time (Figure 11), demonstrated a marginally significant effect, F(2,12)=3.71 (p=0.06), for TDS and a significant effect, F(2,12)=14.85 (p=0.00), for shot time.
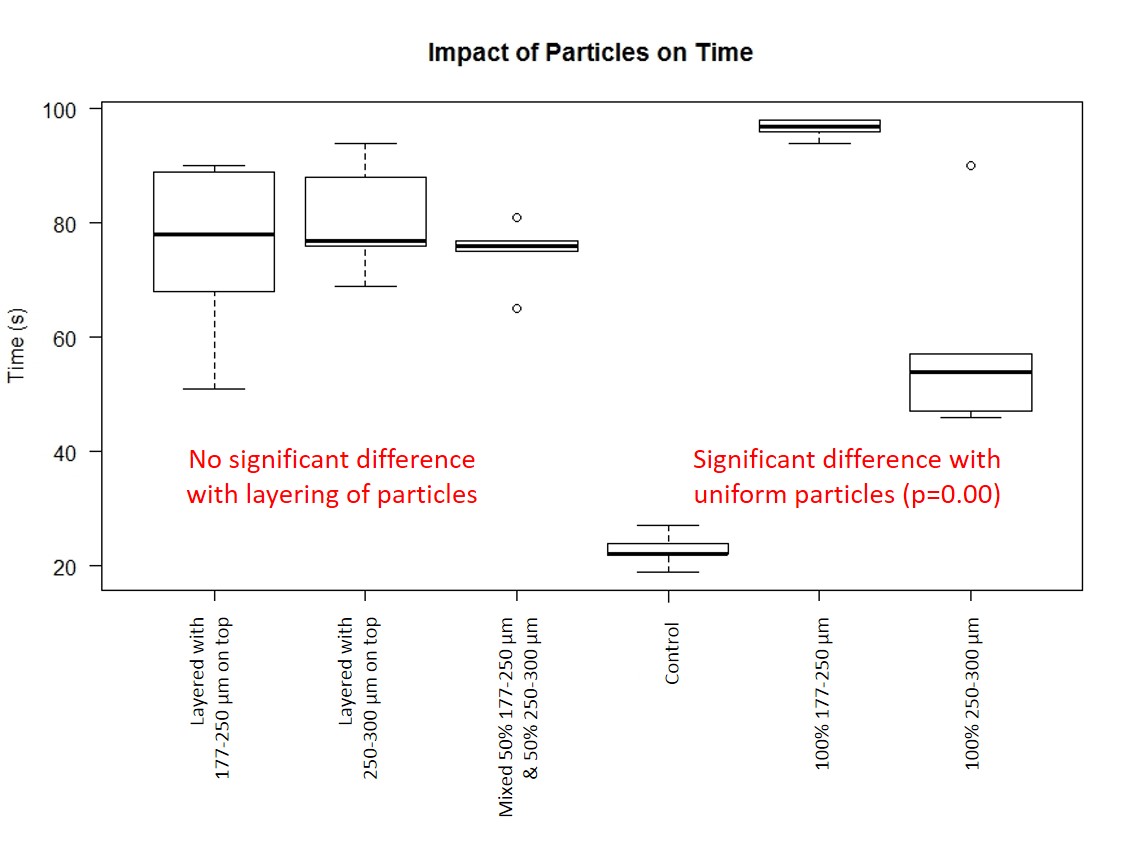
Figure 11. Boxplots showing the average and variability of time for shots in each condition.
Looking more closely at the effects of particle uniformity and size, contrasts between conditions revealed significantly lower TDS from particles of 177-250 µm compared to 250-300 µm and control (p=0.00), but not compared to the 50/50 mix of the two particle stratifications (p=0.08). As for total shot time, all perturbations of comparison between conditions differed significantly (p=0.00 for all)—i.e., 177-250 µm only differed from all other conditions (control, 50/50 mixed, 250-300 µm only); 250-300 µm only differed from all other conditions (control, 50/50 mixed, 177-250 µm only); 50/50 mixed differed from all other conditions (control, 177-250 µm only, 250-300 µm only); and, the control differed from all other conditions (50/50 mixed, 177-250 µm only, 250-300 µm only).
(Raw data can be downloaded in a tab delimited text file here. As always, while we offer the data for your personal use, we kindly ask that you send a message to info@socraticcoffee.com before posting or presenting it in any public forum and attach appropriate acknowledgement.)
Conclusions
It is useful to think of this as two mini-experiments (Table 1), each with two dependent variables. One experiment tested the placement of particle sizes within the puck, quantifying the effect on TDS and shot time (Conditions 1, 2, 5, & 6). In some ways, this can be thought of as looking at the oft-mentioned concept of “fines migration”. The other experiment tested the effect of particle size alone on TDS and shot time (Conditions 3, 4, 5, & 6). This can be thought of as looking at uniformity of grinds for espresso extraction. Conditions 5 & 6 serve as control conditions for comparison. Though the control condition incorporated more small particles into the puck, it incorporated far more large particles (Figure 12).
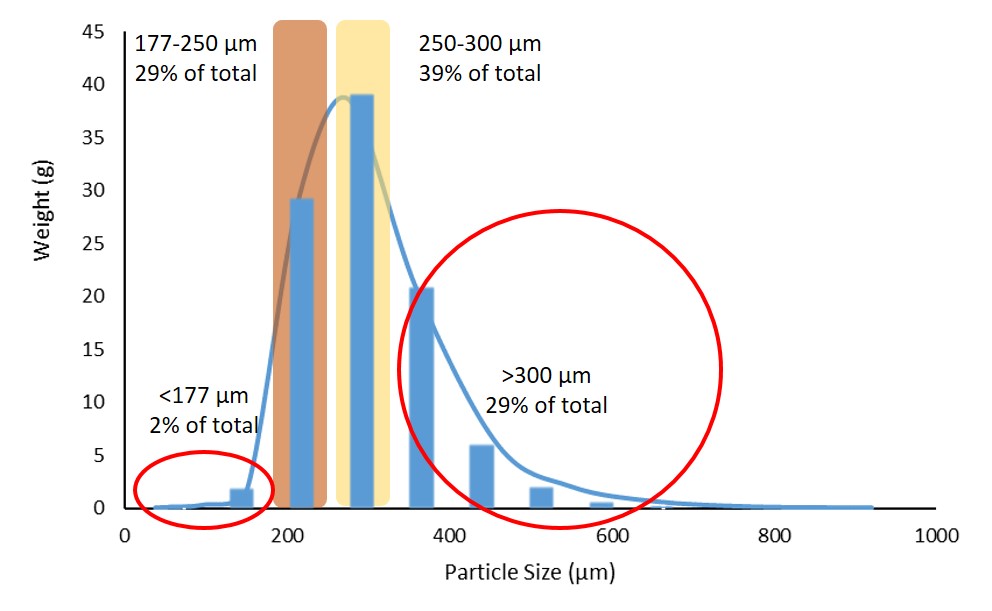
Figure 12. Particle size distribution of the control condition EK43 shot.
Table 1. Summary of the results from the experiment, showing the conditions compared for each “mini experiment”.
| Fines Migration
(Conditions 1, 2, 5, & 6) |
Uniform Particle Size
(Conditions 3, 4, 5, & 6) |
||
| Impact on TDS | Placement of particles did not lead to significant differences. | Impact on TDS | Uniformity of particles did have a significant effect. Smaller particles led to less TDS. |
| Impact on Shot Time | Placement of particles did not lead to significant differences. | Impact on Shot Time | Uniformity of particles did have a significant effect. Smaller particles led to longer shot times. |
Tortuosity, or the diffusion of water through the coffee bed, is the main principle we are most likely affecting here. The physics of the interactions between particle size, morphology, roast development, axial compression and the coffee bed matrix, etc. requires significant and complex methods to examine each variable in isolation. But we are often left wondering how to apply the knowledge gained to a café or home setting. For instance, the often discussed “fines particles migration” was described by Petracco and Liverani (1993) as they observed “transient flow” changes upon reversing the direction of the water through a packed coffee bed. Even the earlier cited study (Corrochano et al., 2015), which discusses many of the variables impacting flow through a coffee puck, assessed the permeability and flow rate of an espresso puck after extracting the coffee for 600 s. Reversed flow and 10 minute extractions are not typical approaches to coffee brewing. We argue that our methodology here is much more applicable to an actual café or home user setting.
While we are the first to admit our work is not absolutely conclusive, it provides well-controlled, objective data addressing two commonly discussed concepts in coffee: “fines migration” and “particle distribution for espresso”. We would argue, based on our data, that the theory of fines migration does not appear to play a critical role in espresso extraction with respect to TDS and shot time, as performed by the average consumer. Further, we would argue that uniformity of particle size for espresso does not seem to yield beneficial effects if your goals are rapid and thorough extraction of coffee solubles. Unexpectedly, smaller particles led to less overall extraction but greatly increased shot time. We suspect this is due to a phenomenon often referred to as “jamming” in the study of fluid flow through porous media. This jamming effect may lead to increased resistance faced by the water, hence the increased shot time, but also blocking of particle surfaces for potential extraction. Our work does not address what level of variability might be ideal for espresso extraction; it simply suggests some variability leads to faster and more efficient extractions.
We intentionally did not collect or present any subjective data. We feel it is the role of the barista/café owner to determine the desired taste given his/her equipment, coffee, water, and preference. Our data is meant to compliment and better inform the coffee community so that they may arrive at their desired taste more efficiently, effectively, and consistently.
References
Corrochano BR, Melrose JR, Bentley AC, Fryer PJ, Bakalis S. 2015. A new methodology to estimate steady-state permeability of roast and ground coffee in packed beds. J Food Eng, 150, 106-116.
Petracco M, Liverani FS. 1993. Dynamics of fluid percolation through a bed of particles subject to physio-chemical evolution, and its mathematical modelization. In: ASIC (Ed.), 15th International Conference on Coffee Science, 702-711.
Laurie
Absolutely brilliant guys!
Fascinating conclusion regarding finer particles leading to reduces TDS. Also great to see someone finally nail the coffin into fines migration.
Keep up the great work!
Jeremy
Hi Laurie,
Thanks for the comment! We were excited to put this little experiment together. I’m not sure we put to rest the idea of fines migration per se. To do that, we’d need to label particles of a certain size and visually inspect their position pre & post extraction. At the very least, our data suggests fines migration might not be much of a practical concern in the brewing parameters we tend to use at this time. It could be that particles smaller than what we tested (less than 177 microns) migrate to the bottom of the puck. And, once there, perhaps create unique jamming phenomena. Experiments always seem to create more questions than answers!
Jeremy
Sam
Thanks for sharing this, really interesting. Just some questions : do you mix the grind again after it came out of the sifter? The variance seems so high that one would suspect it’s not homogeneous after sifting. Another Q is – how do you address smaller fines adhering to the bigger particles in sifting, or is it assumed to be a perfect separation? If you have access to microscope you could confirm that directly.
Other minor stuff : the figure for Condition 4 is wrongly linked…and why include a trend line on the scatter plots? It was quite confusing initially for me (just my opinion).
Thanks again for sharing your work!
Jeremy
Hi Sam,
Thanks for the feedback. After sieving, the coffee particles were mixed again with some brief stirring and dispensed into the portafilter basket using the blind tumbler. It is possible that within a particle size band, there was a non-homogeneous distribution of the narrowly-banded particles within shots. The best way to minimize potential effects of that is through methodological controls, such as increased sample size. Adherence of fine particles to larger ones is just something we can never completely get away from using sieves. Again, we try to minimize the “noise” potentially caused by something like that through methodological controls to reveal the true signal caused by the manipulation. Undoubtedly, factors, such as the ones you mentioned, create some of the variability in our readings; however, with the use of inferential statistics, we attempt to tease apart the variability caused by explained and unexplained variables.
We included trend lines because they are typical on scatter plots and can often help elucidate potential relationships between the variables. For these plots, specifically, I think they also help visually connect the data for each condition. But, I also agree that it can be confusing at first glance. There’s a lot going on!
Figure link was corrected–thanks!
Jeremy
@waroros
Congratulation and thank for your 8 hours of work. So, next suspect in espresso extraction, after unimodal and time, is shape of particle.
I have a question, why don’t you include fines, particles under 177um. Is it possible that fine migration are from those particles?
Thanks
Jeremy
If only this was just 8 hours of work! The hours of planning, pre-testing, analysis, writing up, etc. were far more than that!
Particle shape is definitely a factor we want to look into because it may reveal some very interesting things. We are talking now with some companies that might be able to help us with that.
You bring up a good point with regard to particles smaller than 177 microns–something we cannot rule out! We typically aren’t able to get a significant quantity of particles below that point. But, let’s walk through this logically. With 2% of the total particle distribution potentially falling into that range, assuming the “30% maximum solubility” of a coffee particle, in a 20 g espresso puck, those fines (below 177 microns) represent a total of 0.12 g of potential solubles (next to 5.88 g of solubles for the rest of the distribution). Let’s assume you dose 20 g, get a TDS reading of 10.0%, and a final beverage mass of 40 g. If we add the total soluble weight possible from the fines, our extracted mass moves from 20.0% to 20.06%. If we subtract the total soluble weight possible from the fines, our extracted mass moves from 20.0% to 19.94%. Then, if you consider the variability in your refractometer for assessing TDS (0.05 for VST in espresso range), using the same parameters as above, that alone gives you an actual extraction yield range of 20.1-19.9%. So the contribution of fines is lost within the noise of the method of measurement.
Now, it’s entirely possible that those fines, in their very small numbers and rather insignificant mass, still cause some significant changes in the dynamics of the extraction. Jamming, for instance, is a phenomenon we’d like to explore more closely with respect to its application in espresso extraction. Hard to say right now.
Best,
Jeremy
Chris Kornman
Really impressive stuff. I love how thorough you are with these write-ups, some incredibly useful information here. I often feel confined by the tools available to me, whether a portafilter, extractometer, or water activity meter. I find it immensely valuable that you are examining both the impact of variables on things like extraction, but also testing the reliability and usefulness of the tools used. Keep up the great work. Cheers!
blake
hello,
I m a barista in china.Thank you very much for sharing this experiment ,this is very interesting and exactly what i going to do for exploring about espresso coffee.I wanna ask if i could translate ur article in my account for share to more baristas in China ?
Again ,thank you so much for sharing .
best,
Blake
blake
hello again,
I just left a wrong email at the last comment ,so now I leave a correct one lol.
best,
blake
Jeremy
Hi Blake,
Sure, we have no problem with you translating the article. We ask that you please include a link to the original and appropriate credit.
Thanks,
Jeremy
blake
hi Jeremy,
thank you so much . I will post the link to original website at then end of my translation.
best
blake
Soso
Great !
I wonder What would be the results on a flow/pressure profiling machine.
This test is wonderful but unfortunately only tells about the classic 9 bar profile, if a machine with ultimate control was used, like Decent espresso machine, wouldn’t you be able to really rule out all the possibilities?
Jeremy
Hi Soso,
As with all of our (and any) experiment, the results are only valid within the context of the experimental parameters–extrapolating beyond that should always be done with caution. Without testing various machines to sufficiently describe their specific pressure curves and without systematically examining the impact of changes in those curves, it’s hard for us to say much about how different pressure profiles may influence extraction results. We are also not familiar enough with objective, independent testing of any equipment to call label anything as “ultimate control” at this time. But we look forward to testing a Decent Espresso machine in the future.
Jeremy
Bill Barrett
Referencing fig 10, did you try to understand and were you concerned about the wide variation of TDS in the 50-50 Mix and to a lesser extent the red “X” Layered? The other groups are so tight on the scatterplot.
Thanks, great job with your experiments.
Jeremy
Hi Bill,
Thanks for the comment! It would be interesting to go back and explore these variables a bit more. Unfortunately, this was a very labor-intensive experiment (more so than usual)! Managing variability within conditions is part of many inferential statistical tests, so, while we may not fully understand why one condition has more/less variability than another, that variability is at least accounted for when comparing the conditions. In the “X” condition (Layered 177-250 Microns Top) from Figures 8 & 9, it would appear that a single data point often deviated a good bit from nearly every condition. When you look at Figure 10, you’ll see that variability and/or outlier data points for some conditions was pretty large (e.g., look at the circle representing an “outlier” data point for the TDS in the “Layered with 177-250 microns on top” around 7.5% TDS and the “Control” condition around 10.6% TDS).
Best,
Jeremy
Karol
Great info provided. Our KRUVE Sifter allows the home brewer or barista champion to customize their grind profile as well. Excellent things happen when you have a consistent grind.
Cheers!
Karol
Robert Aloe
Interesting work. I’ve seen other pieces on different parts of the shot that didn’t find a change in TDS but did for taste. Did you record scores for taste?
I’ve worked on Staccato shots for the past six months, and I haven’t measured TDS, but by my scoring, they are far better than a regular espresso shot. Let me know what you think. The main differences for my setup and yours are using Kruve, which is far more a precision softer than the ones you used, and the layer orientation and size.
https://link.medium.com/SjRQ1MvJ4Y
Jeremy
Hi Robert,
Very interesting stuff you’ve been working on! We do not report subjective scores. I’ve worked in human performance & perception research for far too long and there are simply far too many variables that influence taste beyond the extraction itself that, without an extremely large data sample, it’s nearly impossible to draw any meaningful conclusions. And that’s assuming you exactly match the beverage mass for every shot that you taste… and the temp at which you taste them… and randomize the order of the tastings… and do enough samples of each condition to provide a meaningful result, etc. A big problem we see in many espresso-based experiments is the lack of control of beverage mass, which is far-and-away the largest contributor to TDS content. Without matching beverage mass, the tasting of shots is somewhat meaningless since you cannot differentiate whether perceived differences are due simply to strength differences and/or compounds that make up the dissolved solids. We use an industrial sieving system and spent several months validating our sieving protocol (e.g., <1% shifting, had samples run through a particle analyzer). Further, all of our sieves came with traceable ASTM E11-13/NIST standard compliant certificates. We think the Kruve equipment is great for home use, but I'm not sure how your Kruve setup and technique offer more precision than our equipment and protocol. As noted in this particular study, layering of particles did not lead to a significant change in extraction. But I will try your technique with my own Kruve setup and see what happens!
Best,
Jeremy
Robert Aloe
Jeremy,
So the difference between Kruve and the NIST standard is the shape of the hole. The NIST standard is square, Kruve is circular, so the error in sifting is huge in comparison (https://link.medium.com/neBPEN3Ey0).
I use a measuring cup during extraction, and I usually get 1:1 extraction most shots. I have seen how that affects subjective scores, but to say that subjective scores are meaningless ignores that taste is subjective. Have you proven or has anyone else proven that TDS being higher is always better? It is possible that what you’re extracting is not tasting good even with a higher TDS. I do plan on buying a refractometer in the next few months, but I have a bit of skepticism.
I also think one can accumulate enough data to show correlation and break it down by roast and machine to help control for variables (https://link.medium.com/8cCs0TlFy0). Of course, a blind taste test would be better, but I haven’t had time for that.
Anyhow, did you give staccato a try?
-Robert
Jeremy
Hi Robert,
All measurement techniques have limitations. And it’s important to understand them when you interpret any data collected. The square-v-circular sieve hole is not a major concern, especially when it comes to a material with such heterogeneous morphology as coffee. The sieve pore shape doesn’t remove issues of blinding, for instance, nor all the concerns with regard to a material’s adhesive qualities, surface structure, etc. More important, regardless of what pore shape you use, is repeatability and consistency in approach (again, that’s why we spent months developing and validating our particular sieving protocol).
We’ve never said taste is meaningless, only that it is subjective and not easily communicated/calibrated across people. So for us to report on perceived taste changes is really not an informative exercise. As for TDS being higher always equaling “better”, that’s a valid point. It is interesting to think what the term “overextracted” would mean if higher is always supposed to be better. TDS provides you with an objective assessment of your solution strength, nothing more. Research from the Coffee Brewing Institute in the 1950s showed that different compounds extract from coffee particles at different rates, so one might hypothesize that equal TDS solutions achieved with different extraction times could be made up of different ratios of flavor constituents.
We wish you luck on your cataloging of taste samples.
Will attempt a staccato tomorrow!
Jeremy