Abstract
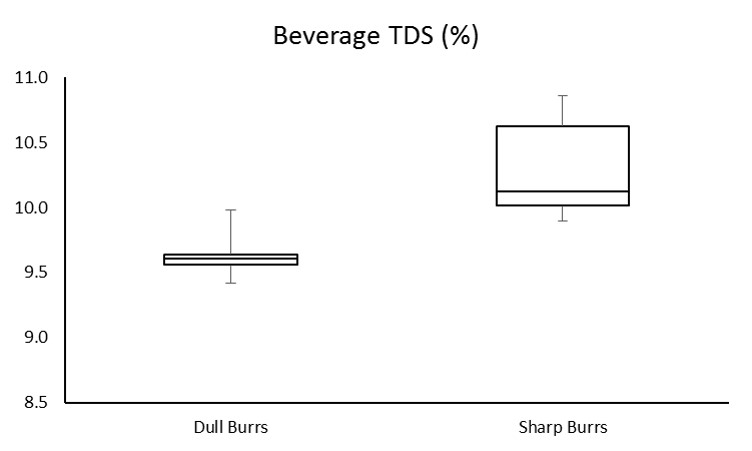
This experiment assessed differences in espresso total dissolved solids (TDS) as a factor of burr sharpness. Ten shots were pulled for each condition (sharp burrs, dull burrs) and TDS measured using an Atago PAL-COFFEE refractometer. Results revealed a significant decrease in TDS in the dull burr condition (p = 0.00).
Disclosures
We have no vested interest in any of the products being tested.
Authors
Joe and Jeremy
Introduction
Maintenance of equipment is a critical part of making consistently good coffee. Further, given the costs of high end coffee equipment, it is important to have objective metrics to assess state of performance. For many settings, reliance solely on subjective perception (i.e., taste), with all of its caveats and potential for bias, is less desirable and could lead to significant quality fluctuations and/or inconsistencies. While simply a tool to help guide the way, much like a compass when someone is lost in the woods, refractometers have been adopted in the specialty coffee community as a means of quantifying the soluble concentration in coffee. It has been proposed that this tool can help provide information regarding the state of equipment (e.g., burr sharpness). We set out to test if a currently available coffee-oriented refractometer is useful in assessing burr sharpness, as we were curious if the impact of sharpness alone was significant enough to be detected by the device.
Methods
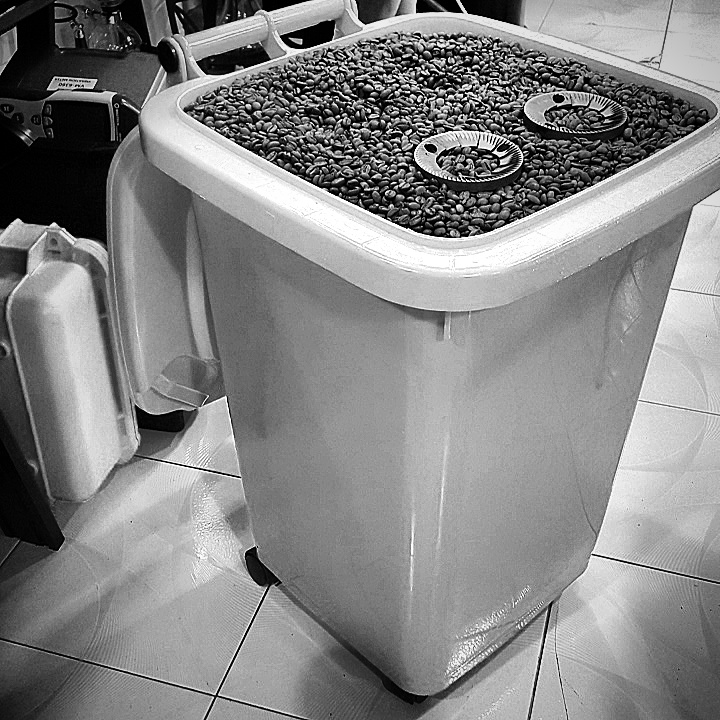
The coffee used for the experiment was a single origin Guatemalan (Agtron values: 71 whole bean; 76 ground). Coffee was rested for 6 days before use.
Equipment used:
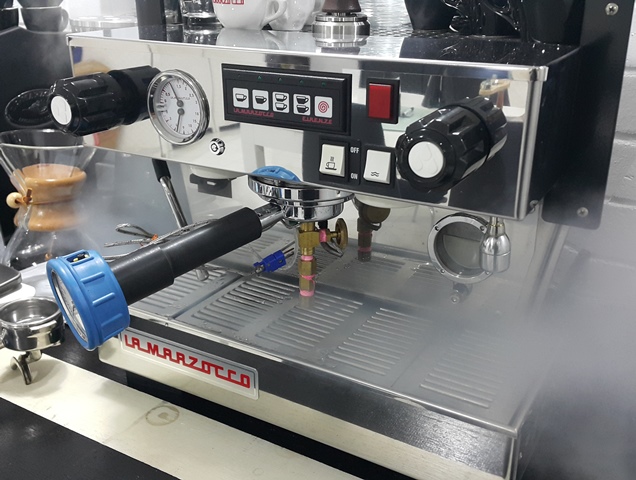
- La Marzocco (LM) Linea, single group fitted with 0.6mm restrictor and a naked portafilter with the original LM basket, set at 9 bar water pressure (verified with a Scace II); brewing temperature 94 degrees C regulated with a PID on board
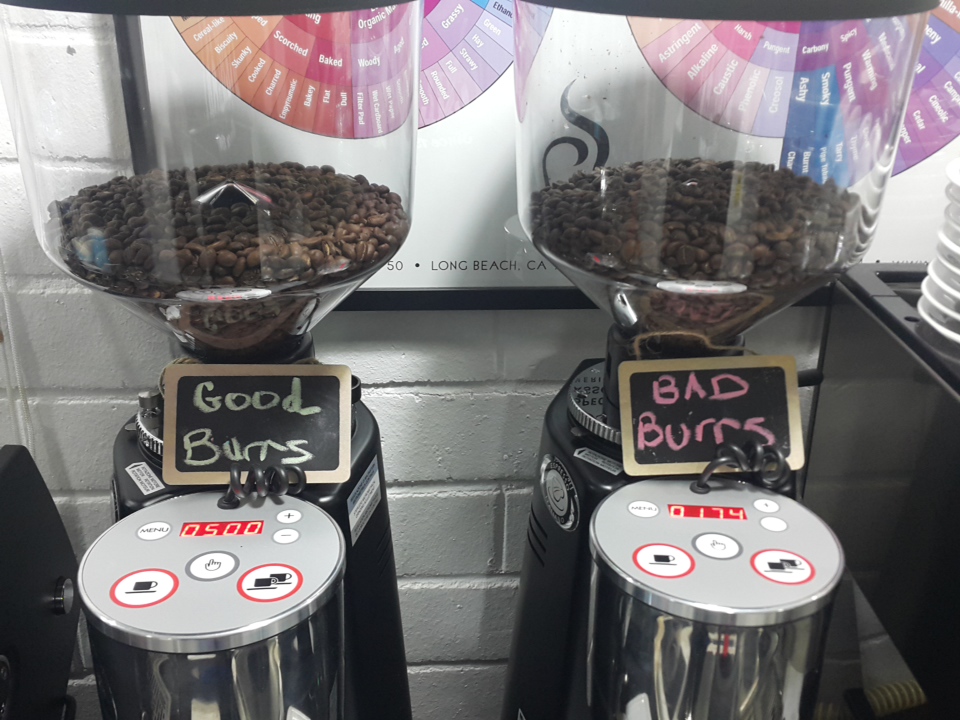
- 2 x Mazzer Major E
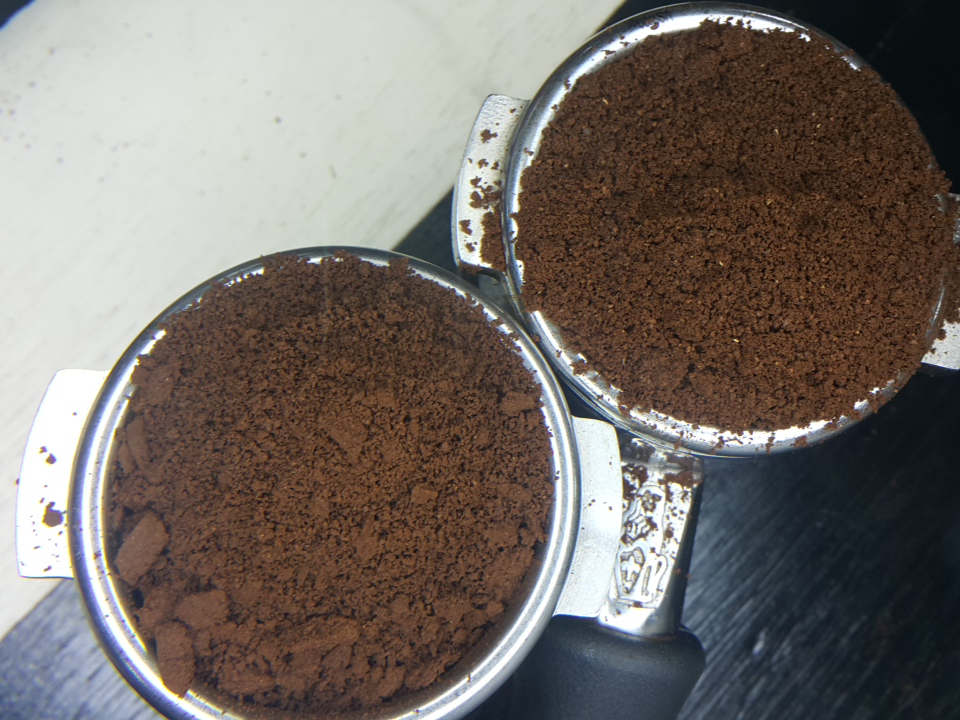
- One with a set of burrs seasoned with 8kg of coffee (“Sharp Burr” condition)
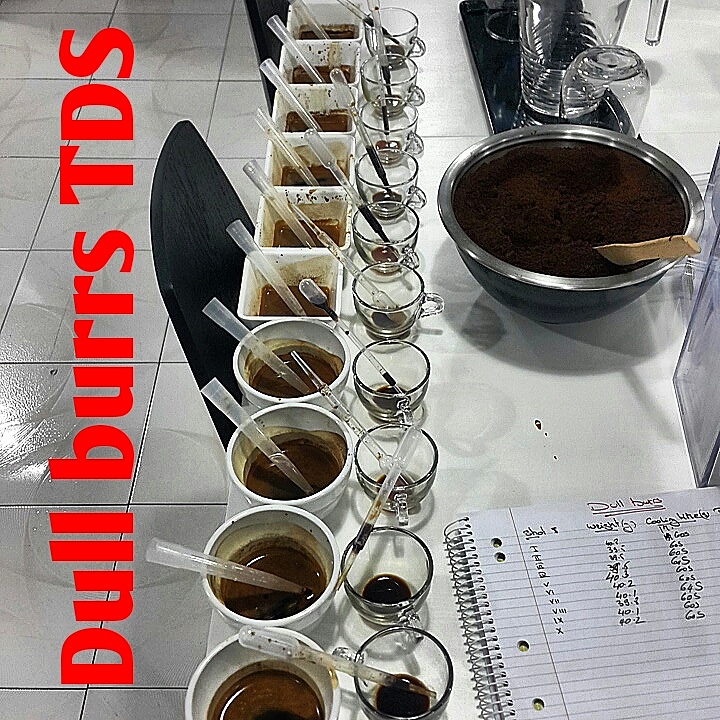
- One with a set of burrs previously used to grind approximately 1500kg of coffee (“Dull Burr” condition)
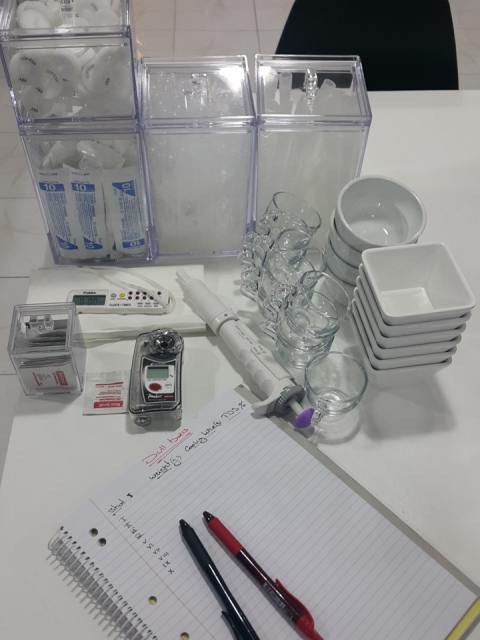
- Two scales (Ohaus to measure the dry coffee dose; AWS to measure the beverage mass)
- Pen and paper to record values
- FLIR thermal camera
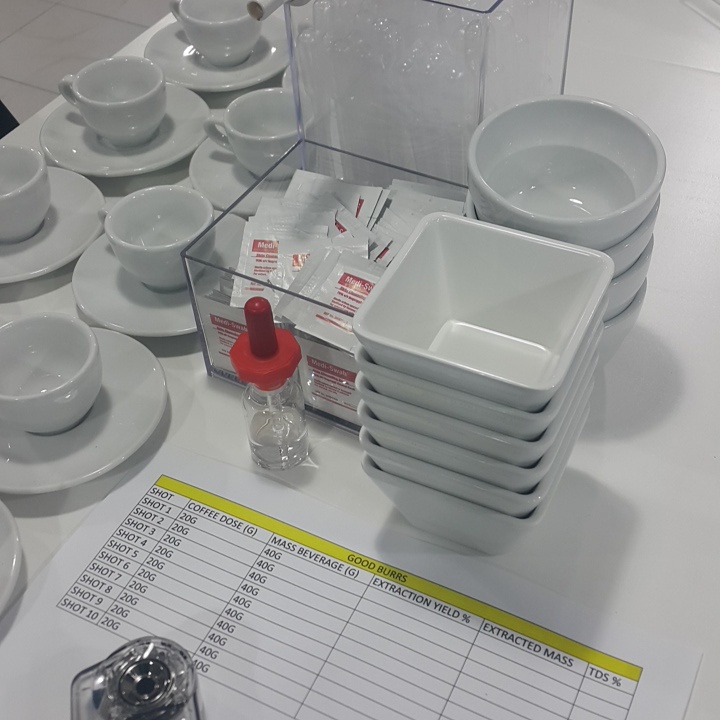
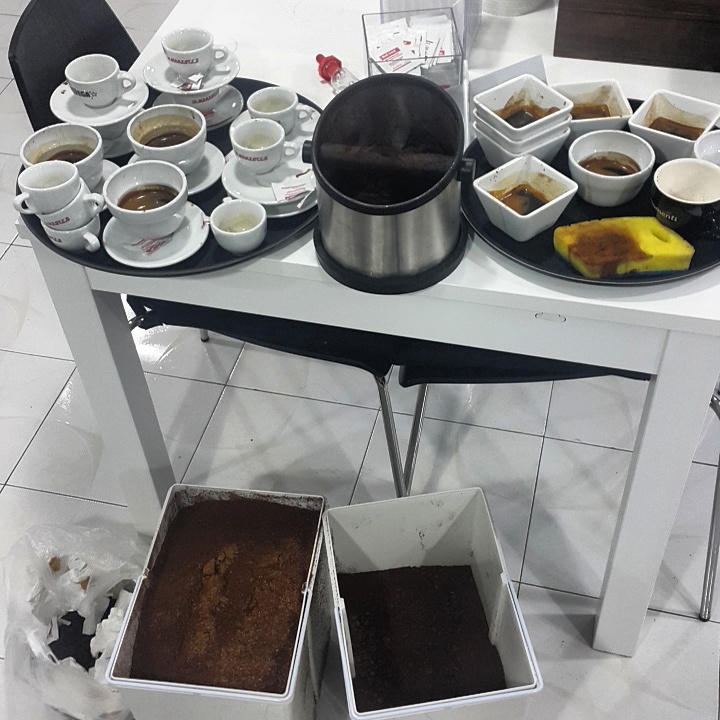
- 10 (for each grinder) x empty ramequin bowl for measuring the mass of the shot
- 10 (for each grinder) x ceramic/glass cups for TDS measurement
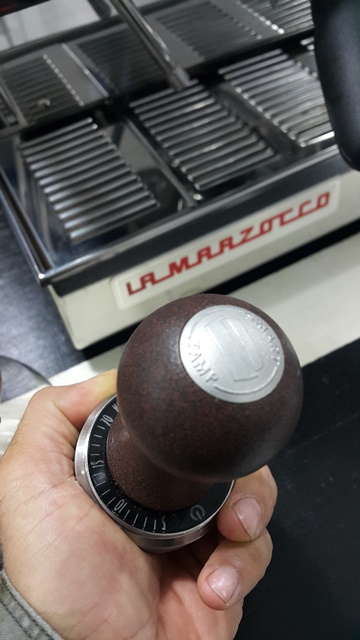
- Smart Tamp tamper to standardise the pressure applied to the coffee
- Atago PAL-COFFEE refractometer
- Distilled water
- Alcohol pads
- Pipettes
- Serviettes
Experiment was carried out over two nights; however, all conditions with the grinders, espresso machine, and equipment used was kept the same. For the grinders, blades were warmed up by grinding a 500 g of coffee beans. The room temperature was controlled with air conditoning at approx 22-24 degrees C for both nights. Distilled water used to zero the refractometer and was stored with the device at the ambient room temperature.
A brew ratio of 1g coffee to 2g brew weight was used (i.e., 20g dose for 40g final beverage mass). For each shot pulled, the coffee grinder was dialed in accordingly. [Note: Dialing in a grinder is subjective and open to interpretation, leaving room for potential confounds. For future experiments, we aim to minimise potential subjective influences in this area, possibly by using the our sieve sifting system to create equal distributions between conditions.]. A total of 10 shots were pulled for each grinder.
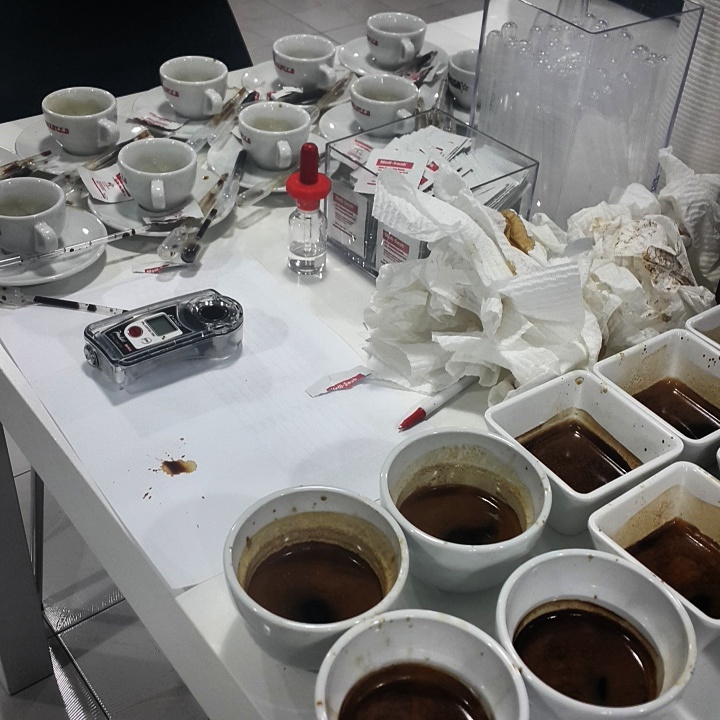
Atago refractometer was prepared and cleaned with alcohol pad before zeroing it with distilled water. Similarly, the refractometer was cleaned with a new alcohol pad after every reading.
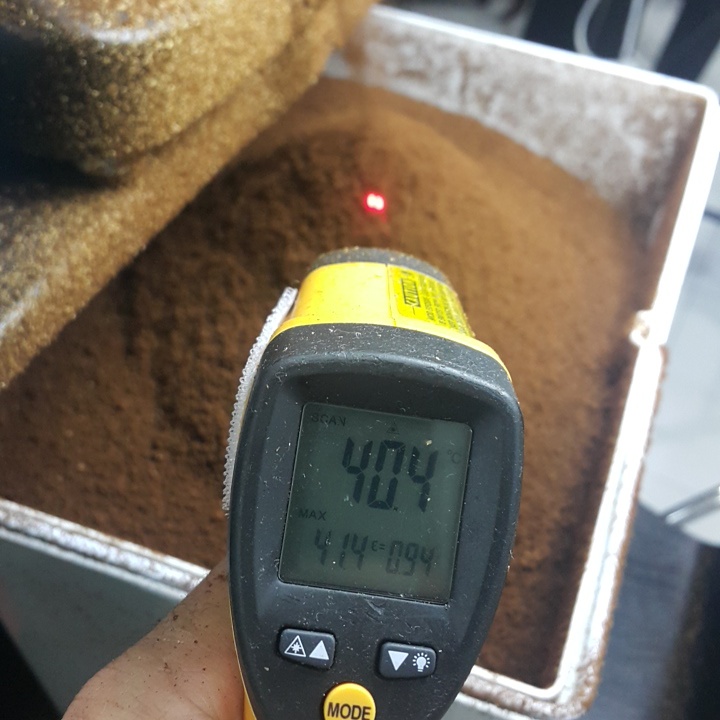
After pulling a shot, the beverage was allowed to cool for approximately 1 minute. Crema was removed with a spoon and a pipette, which was rinsed with the espresso, was used to siphon approximately 3 ml. This sample was then placed into a ceramic cup and swirled to further cool it down to 25 degrees. Temperature was verified with a thermal camera. A second pipette was then used to move the sample from the ceramic cup to the well of the refractometer. The TDS value was recorded.
Results
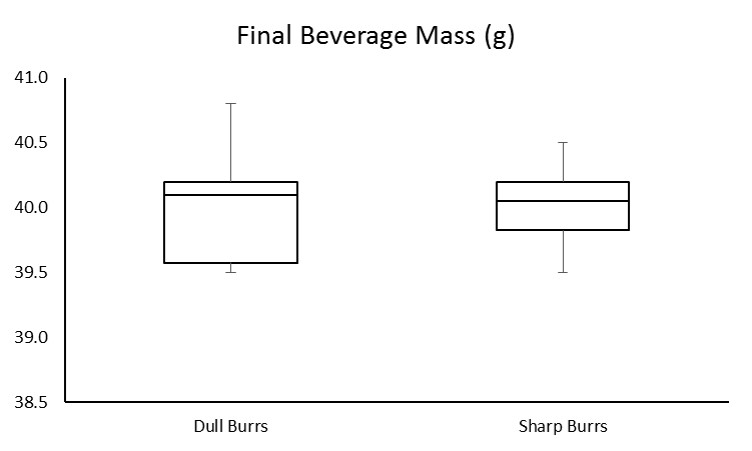
An analysis of variance (ANOVA) was used to compare shot weights and TDS readings. No significant difference was found in the shot weights between conditions (F(1,18) = 0.03, p = 0.86). However, a significant difference was found in TDS (F(1,18) = 4.41, p = 0.00), with higher TDS readings in the sharp burr condition.
(Raw data can be downloaded in a tab delimited text file here. As always, while we offer the data for your personal use, we kindly ask that you send a message to socraticcoffee@gmail.com before posting or presenting it in any public forum and attach appropriate acknowledgement.)
Conclusions
This study aimed to assess the impact of burr sharpness on beverage TDS. A difference in TDS was observed, with the sharp burr condition yielding significantly higher TDS than the dull burr condition. From this experiment, it would appear that TDS may be a useful tool to determine the sharpness of grinder burrs. However, additional experiments would need to be performed to assess the sensitivity of using TDS for sharpness of burr determinations (i.e., what quantity of grinding is necessary before quantifiable changes in TDS are observed). Further, the TDS changes produced by burr sharpness may or may not follow a linear curve. Some have suggested TDS may be useful in assessing when new blades have been “seasoned”. Quantifiable metrics should be developed to aid in this determination. Lastly, it would also be helpful to have a more objective measure of overall burr sharpness.
Dustin
So when you dialed in the grinders, you did so by taste?
Jeremy
Hi Dustin — yes, the grinders were dialed in using subjective assessments (e.g., visual appearance and taste). We realize this is not ideal and will try to use more objective metrics next time, such as weight-over-time (to give an idea of flow rate). If you can think of other objective metrics we can use to give a better description of what “dialed in” means, please let us know! One of the more frustrating things about readings others’ accounts of espresso-related assessments is the simple statement of “grinder was dialed in”, which likely has a large impact but is often dismissed as an aspect needing defined parameters rather cavalierly.
Thanks for the comment,
Jeremy
Jackson O'Brien
A more interesting experiment imo would be if two grinders were dialed in to producing approximately the same TDS / extraction levels, times were noted for beverages, and that data that’s collected is blind taste tests between sets of dull vs. sharp burrs to see if 10% TDS on dull burrs tasted objectively worse than 10% TDS on sharp burrs.
Jeremy
Hi Jackson,
Thanks for the comments. There are many variations we could potentially run. One thing we avoid, especially as we’ve matured our approach, is reporting subjective analyses. There are plenty of others in the coffee community willing to give their opinions on that sort of thing. As a hobby lab, it’s just not realistic that we could test the number of samples and use the number of individuals we’d need to gather truly meaningful/useful taste-related data. Human variability in taste perception is just too vast (e.g., http://www.ncbi.nlm.nih.gov/pmc/articles/PMC1698869/).
Jeremy
doublehelix
I really like this study. It is not at all clear how to quantitatively assess burr sharpness outside of a metallurgical laboratory, etc. As such, this study provide important clues for us to consider when thinking about our grinder burrs and what winds up in our cups. My take from this work is that it provides some useful numbers to confirm that changing burrs is a great way to contour your coffee. ??Do sharp burrs leave grounds in a more accessible state to extraction via access to the interior of a ground, or provide more productive conduits through a puck for extraction, or both???? Heat generation? Be interesting to measure temperature after grinding…..
A fun extension to this study would be to change burrs that are new and sharp but offer different grinding surfaces. A Vario might make for a good test bed– ceramic vs. steel burrs?
Alfio
nice Article 🙂
something is missing
– moisture percentage and hardness surface of coffee beans
– temperature of coffee beans
Something more is quantify the change TDS with
– burs diameter and shapes
– rpm of burs
all the best
Alfio
Jeremy
Hey Alfio,
Thanks for the feedback. We agree, there are many more metrics we’d like to capture–hopefully in future experiments!
Jeremy
lennon
good! thank you
Maiserly
Hey Socratic,
In the graph depicting Beverage TDS I am seeing a smaller variance for dull burrs. Do you believe that this is indicative of a more consistent flavor profile for shots pulled using “dull” burrs?
-Maiserly.
Jeremy
Hi Maiserly,
On visual inspection, I agree, the first and third quartiles appear smaller in the dull burr condition compared to sharp burrs. The standard deviations were slightly different (0.35 for the sharp burrs; 0.17 for the dull burrs). If these were vastly different, our statistical test most likely would have failed to find a statistical difference between the two conditions. So, for our purposes, I hesitate to make much of the slight difference in variability and can’t say how it may/may not impact flavor perception. Have you found that duller burrs seem to give you a more consistent flavor profile?
Jeremy
Maiserly
Jeremy,
Anecdotally, yes. I find that sharper burrs deliver inconsistent results tastewise.
-Mike.
Jeremy
Hey Mike,
That’s really interesting! Inconsistent in quality, too, or just overall flavor profile changes?
Jeremy
Frankie
Nice study and interesting data. However, I have a question regarding your procedure. You stated that experiments were performed over two nights. Did you followed a strict order, eg. 10 shots with sharp burrs at night one and 10 shots with dull burrs at the 2nd night? Was the TDS measurement (double-)blinded? I have the feeling, that the small range of the dull burr data was caused by a methodological error, compared to the thoughts of Mike
Also, what was the reason for you performing ANOVA with this small number if observations?
Jeremy
Hi Frankie,
Thanks for the comment! Yes, you may be right–there could have been a systematic error due to methodology. In studies since, we’ve tightened our methodological controls (e.g., incorporated more blinding when able/appropriate, better utilized order randomization). In a recent mini-experiment, we saw that, given the same particle size and extraction protocol, these dull burrs yielded the same extraction as comparable particles ground from sharp burrs (https://instagram.com/p/9gi13HyuMn/). This, in combination with our particle distribution comparison between the burr sets (https://instagram.com/p/9gZxxESuDZ/), suggests that burr sharpness leads to greater variance in grind size (i.e., flattening of the particle size peaks), but that quantitative differences between similarly sized particles does not exist (at least with respect to extractability potential as measured via TDS). It would be very interesting to see if the morphologies of similarly sized particles ground by dull v. sharp burrs is vastly different–or if they vary in some other quantitative extraction metric.
While a t-test could have been performed, it is simply a special case of a one-way ANOVA. The t-test is more liberal than an ANOVA, so our decision to use an F-test was simply to err on the side of conservative statistics (e.g., as shown by Donaldson 1966, the F-test approach is very conservative even with deviations in skew, uneven variances, etc.).
Jeremy
Frankie
Hey Jeremy,
thank you for your reply and your explanation. The morphological influence would be really interesting, you are right. I think the differences will be more prononcouned in pour over as Matt Perger suggest 500 – 700 micron particle size for pour over coffee. My guess, a sharp burr set will provide an even and sharp cut and thus a smaller surface compared to dull burrs.
However, I really like your work and it was long overdue to examine the technical aspects of making coffee. Keep going!
Regards
Frankie
Jeremy
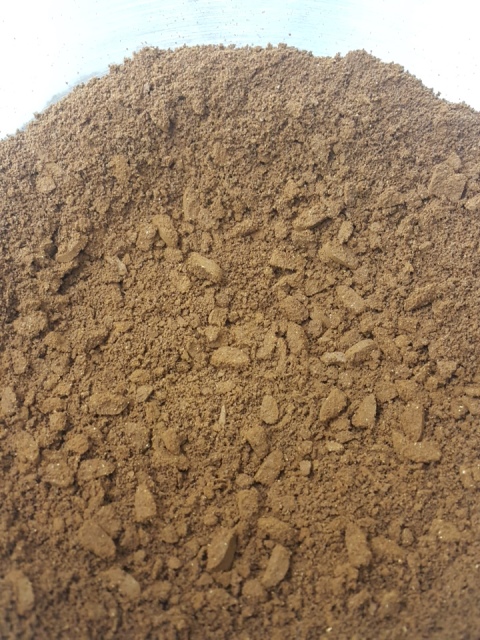
Thanks, Frankie! We’ve established a partnership with a group that can help us do surface area assessment through digital imaging, so that may be something we can quantify in the future. I agree, intuitively, it makes sense that a sharper blade would more cleanly cleave a coffee bean. It’s pretty interesting–there seems to be a change in the shapes of the particles overall as they break down smaller and smaller (i.e., they become less and less homogeneous in their appearance). At least in the 707-841 micron range, we’ve observed the particles are more solid boulders (e.g., https://instagram.com/p/825i_OyuOi/) but, as you move into the “fines” range, they become more like little pieces of sticky velcro, much more heterogenous (e.g., https://instagram.com/p/7BCb1byuMv/).
We’ll try to test your idea of extraction differences in the 500-700 micron range with particles from sharp and dull burrs in a few days (we’ll post it on Instagram). If you have any other ideas on future studies we should run or things we should consider, please let us know.
Jeremy
Bill Barrett
Do you have any idea [or guess] what charteristic of the grinds changed between the sharp and dull burrs to cause lower EY?
Thanks for your hard work!
Jeremy
Hi Bill,
It’s hard for us to say as we didn’t collect any data at the time that would give us insight into particle characteristics. We’ve learned a lot in the years since we performed this experiment and our testing protocols are much better and more precise. If we were redoing it, I think we’d incorporate a couple of additional tests (e.g., our solubility protocol with similarly-sized particles from each burr set, analysis of particle morphologic characteristics using something like ImageJ) to collect information on why the extraction potential of the particles from each burr set might differ.
Jeremy