Posted: 02 Jul 15
Updated: 08 Mar 16
Abstract
Continuing with series on refractometer comparisons, the goal of this study was to examine the measurements from three refractometers advertised to measure the total dissolved solids (TDS) content of espresso. As a secondary goal, this study aimed to assess the impact of the VST syringe filters on TDS readings in espresso. In a single experiment, the VST LAB Coffee II Coffee & Espresso Refractometer, VST LAB Coffee III Refractometer, and Atago PAL-COFFEE Refractometer were compared with a total of 12 samples (3 readings per sample) for each device. Testing procedures followed the VST recommended guidelines. No significant difference was found between the devices. The use of the VST sample filter did have a significant effect on TDS reading (p=0.00); however, the effect did not differ for the three devices.
Disclosures
We have no vested interest in any of the products being tested.
Authors
Jeremy and Joe
Introduction
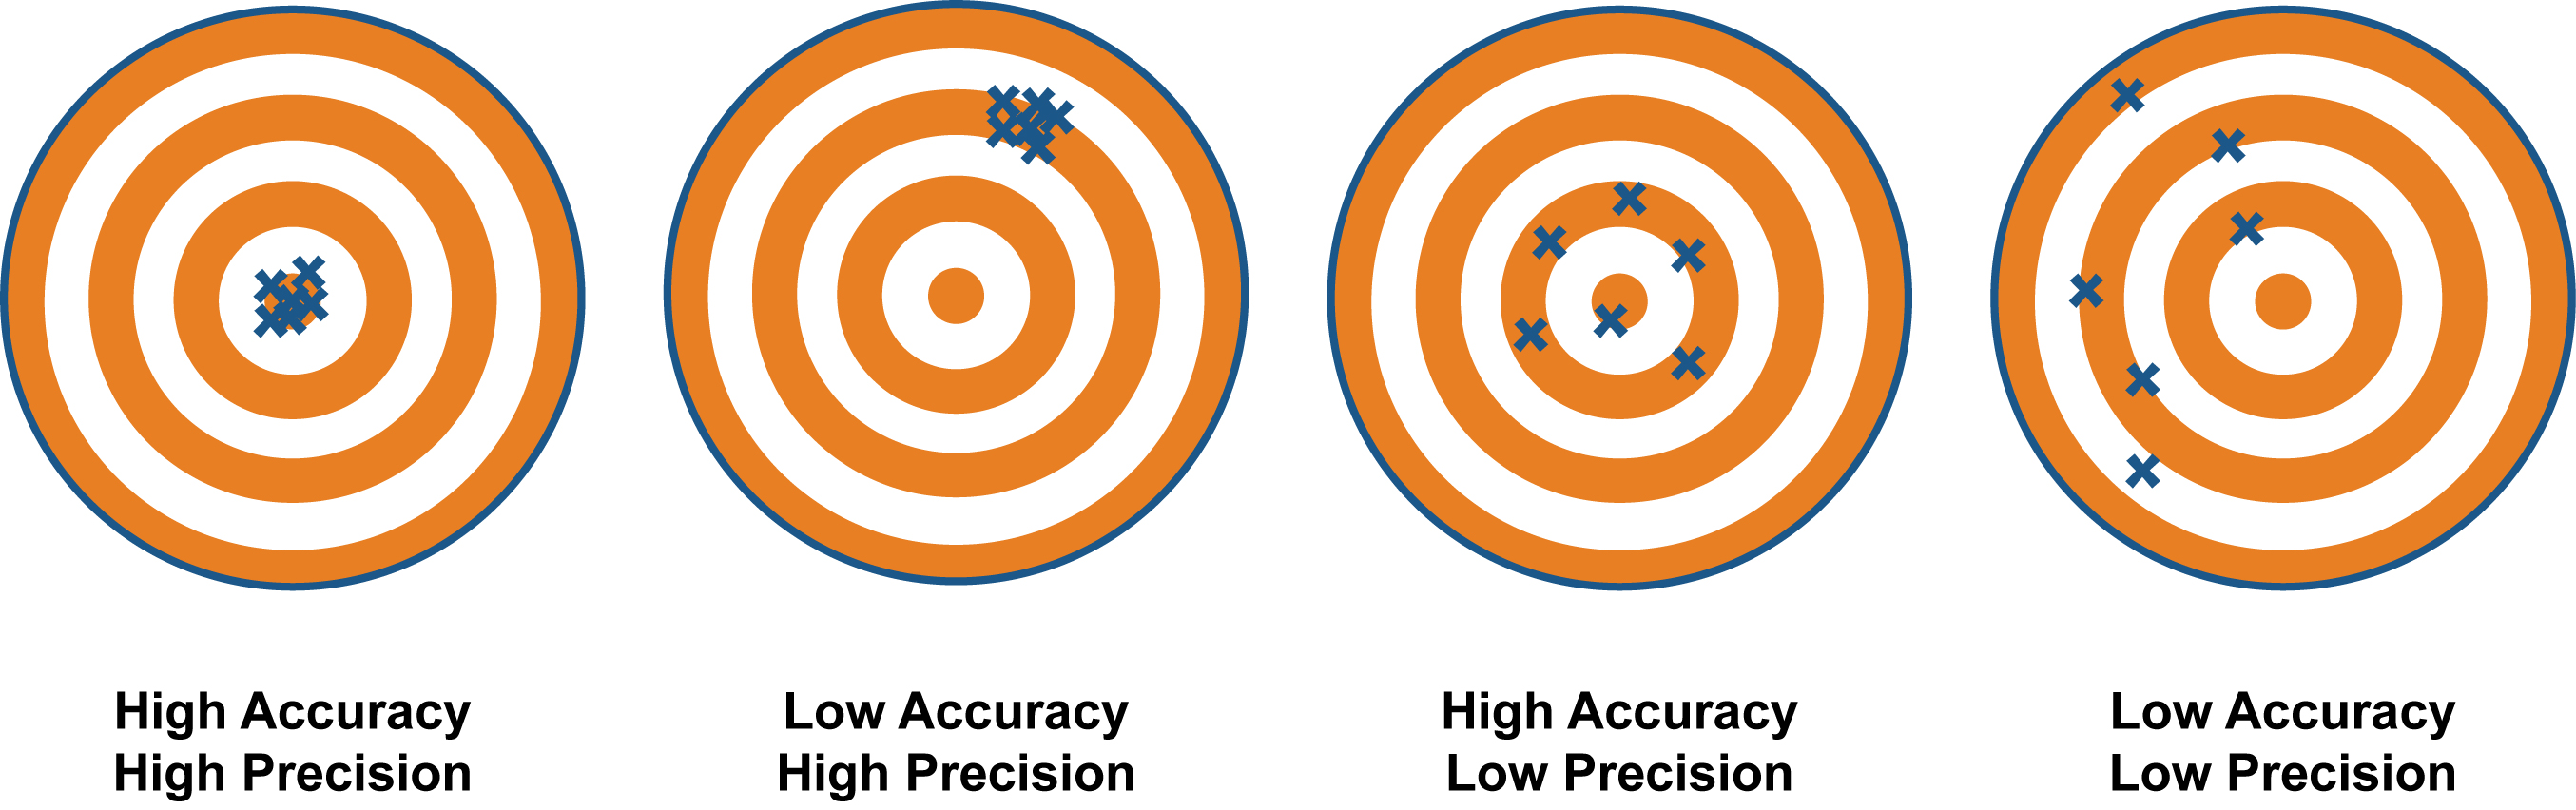
We set out to test the performance of three devices compared against each other, not necessarily assess their individual precision or accuracy against stated manufacturer specifications. However, there were components of precision assessed in the current study design. Precision is a measure of how well a result can be determined–the degree of consistency and agreement among measurements of the same quantity. It is important to remember that a measurement can be precise without being accurate (demonstrated in the graphic below).
Methods
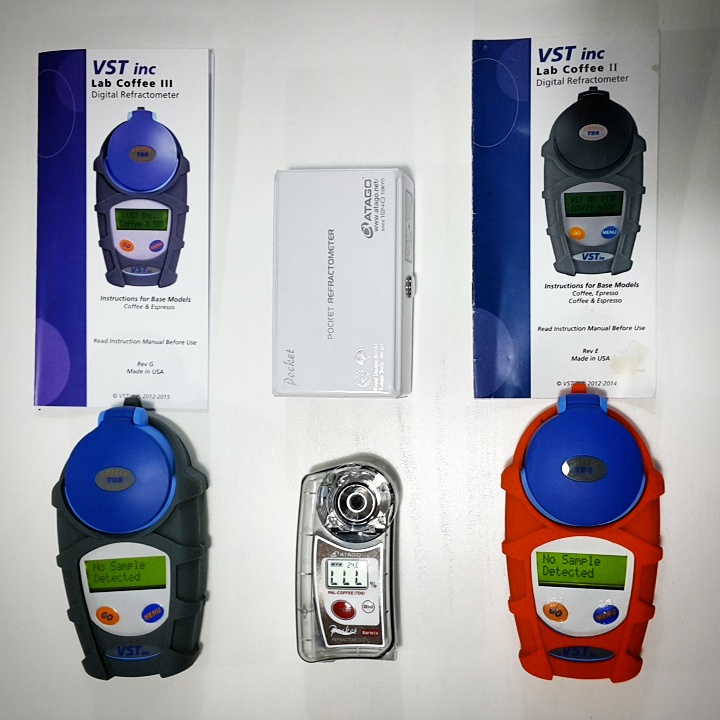
The VST devices used were the VST LAB Coffee III 4th Generation Refractometer (stated range: 0.00-20.00% TDS; TDS resolution 0.01%; precision +/-0.01%; accuracy from 0.00-4.99% of +/- 0.03% and from 5.00-20.00% of +/-0.05%; temperature range of 15-40C) and the LAB Coffee II (Coffee & Espresso) Refractometer (stated range: 0.00-20.00% TDS; TDS resolution 0.01%; precision +/- 0.03%; accuracy from 0.00-4.99% of +- 0.05% and from 5.00-20.00% of 0.10%; temperature range of 15-40C). The Atago device was the PAL-COFFEE (stated range: 0.00-22.00% TDS; TDS resolution 0.01%; accuracy in Brix of 0.10; temperature range of 10-100C; temperature resolution 0.1C). We recommend checking the companies’ sites for more information regarding device specifications. All refractometers were loaded with fresh batteries and, along with container of distilled water, placed on the test bench the night before to allow temperature to equilibrate to ambient room temperature (25C). Distilled water, using a conductivity-based TDS meter, contained 0 ppm and was used to zero all devices.
The coffee used for the experiment was Toby’s Estate Woolloomooloo blend. Coffee was rested for 10 days before use.
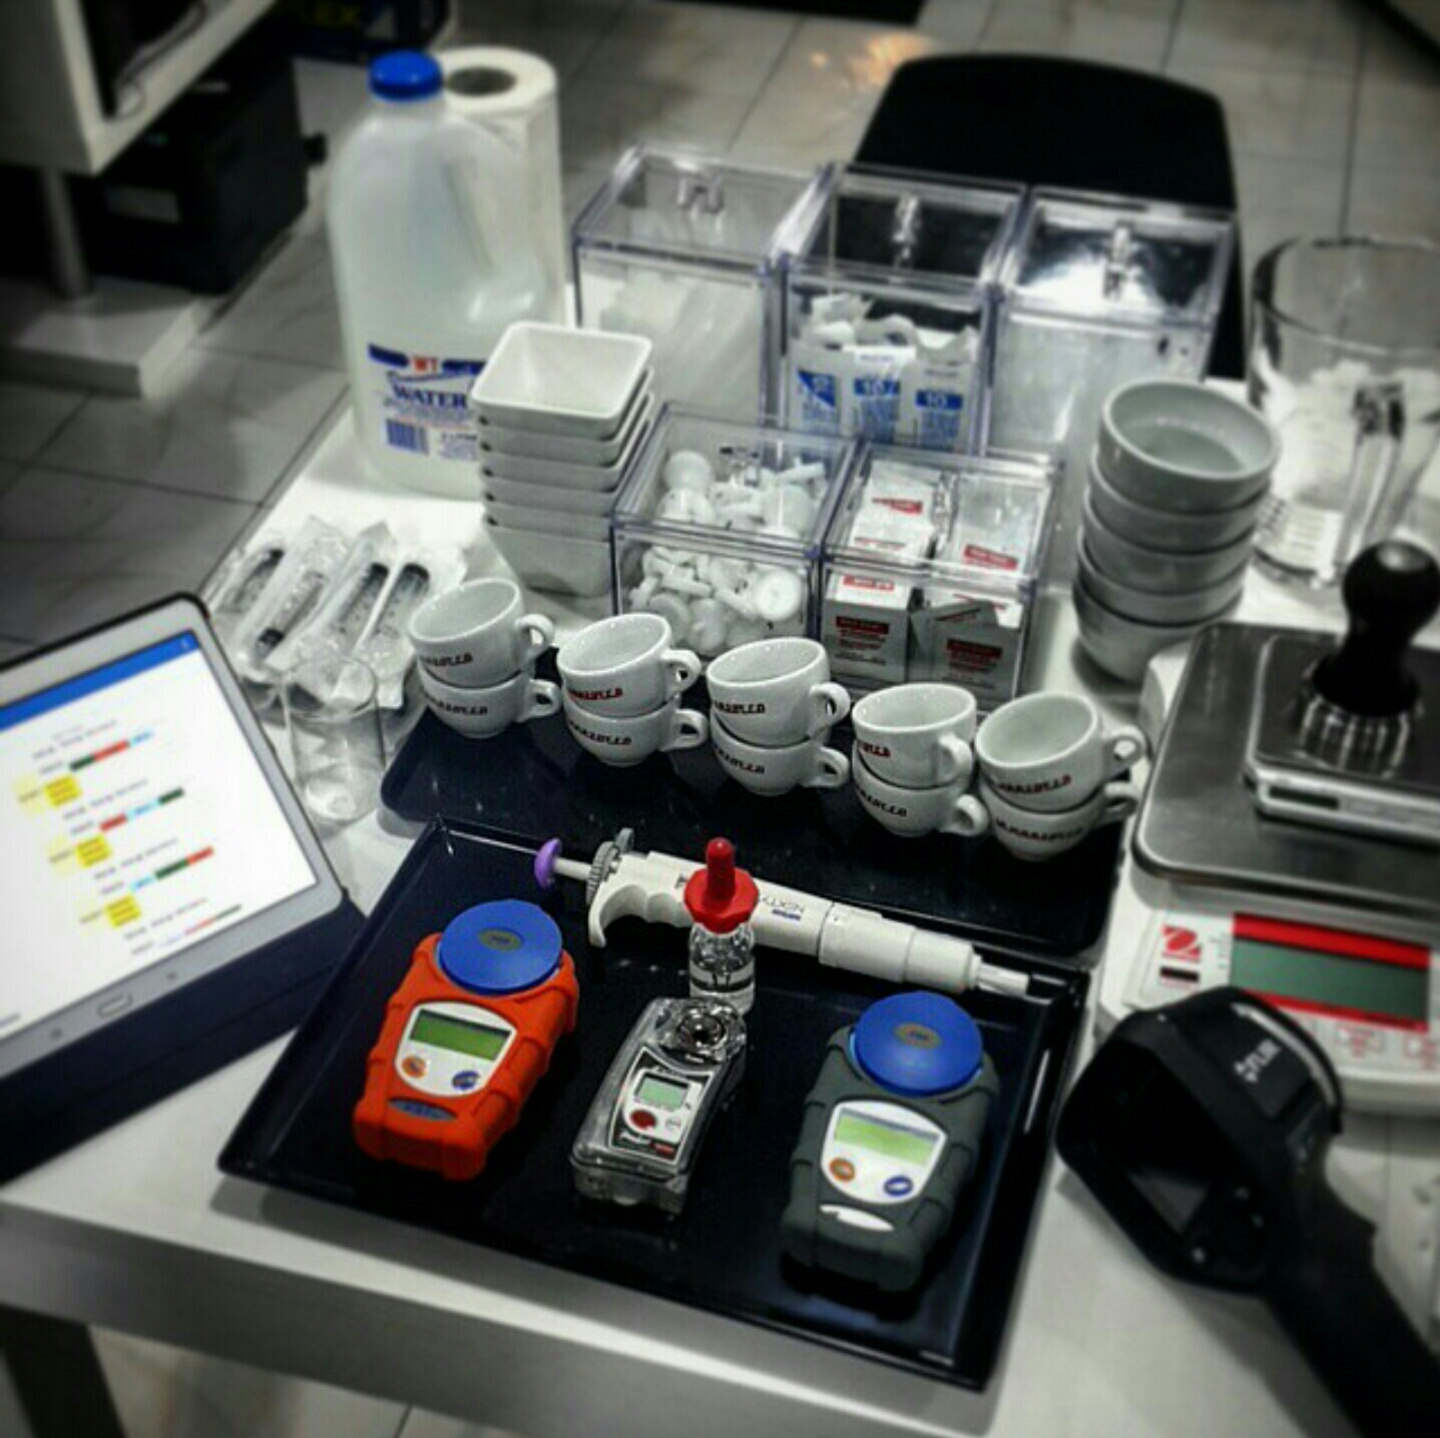
Equipment used:
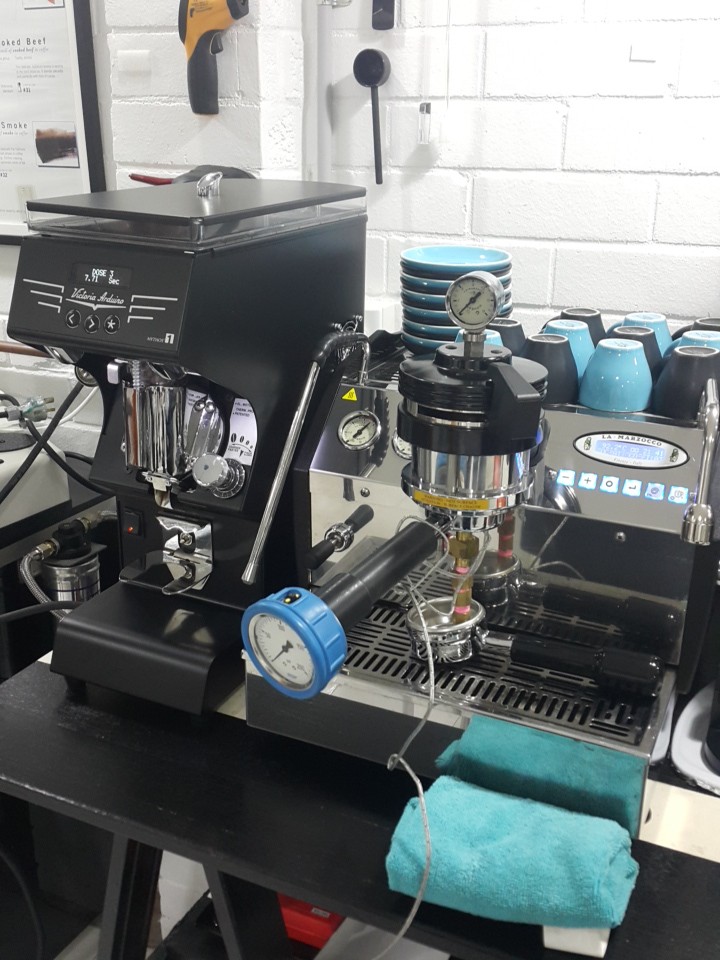
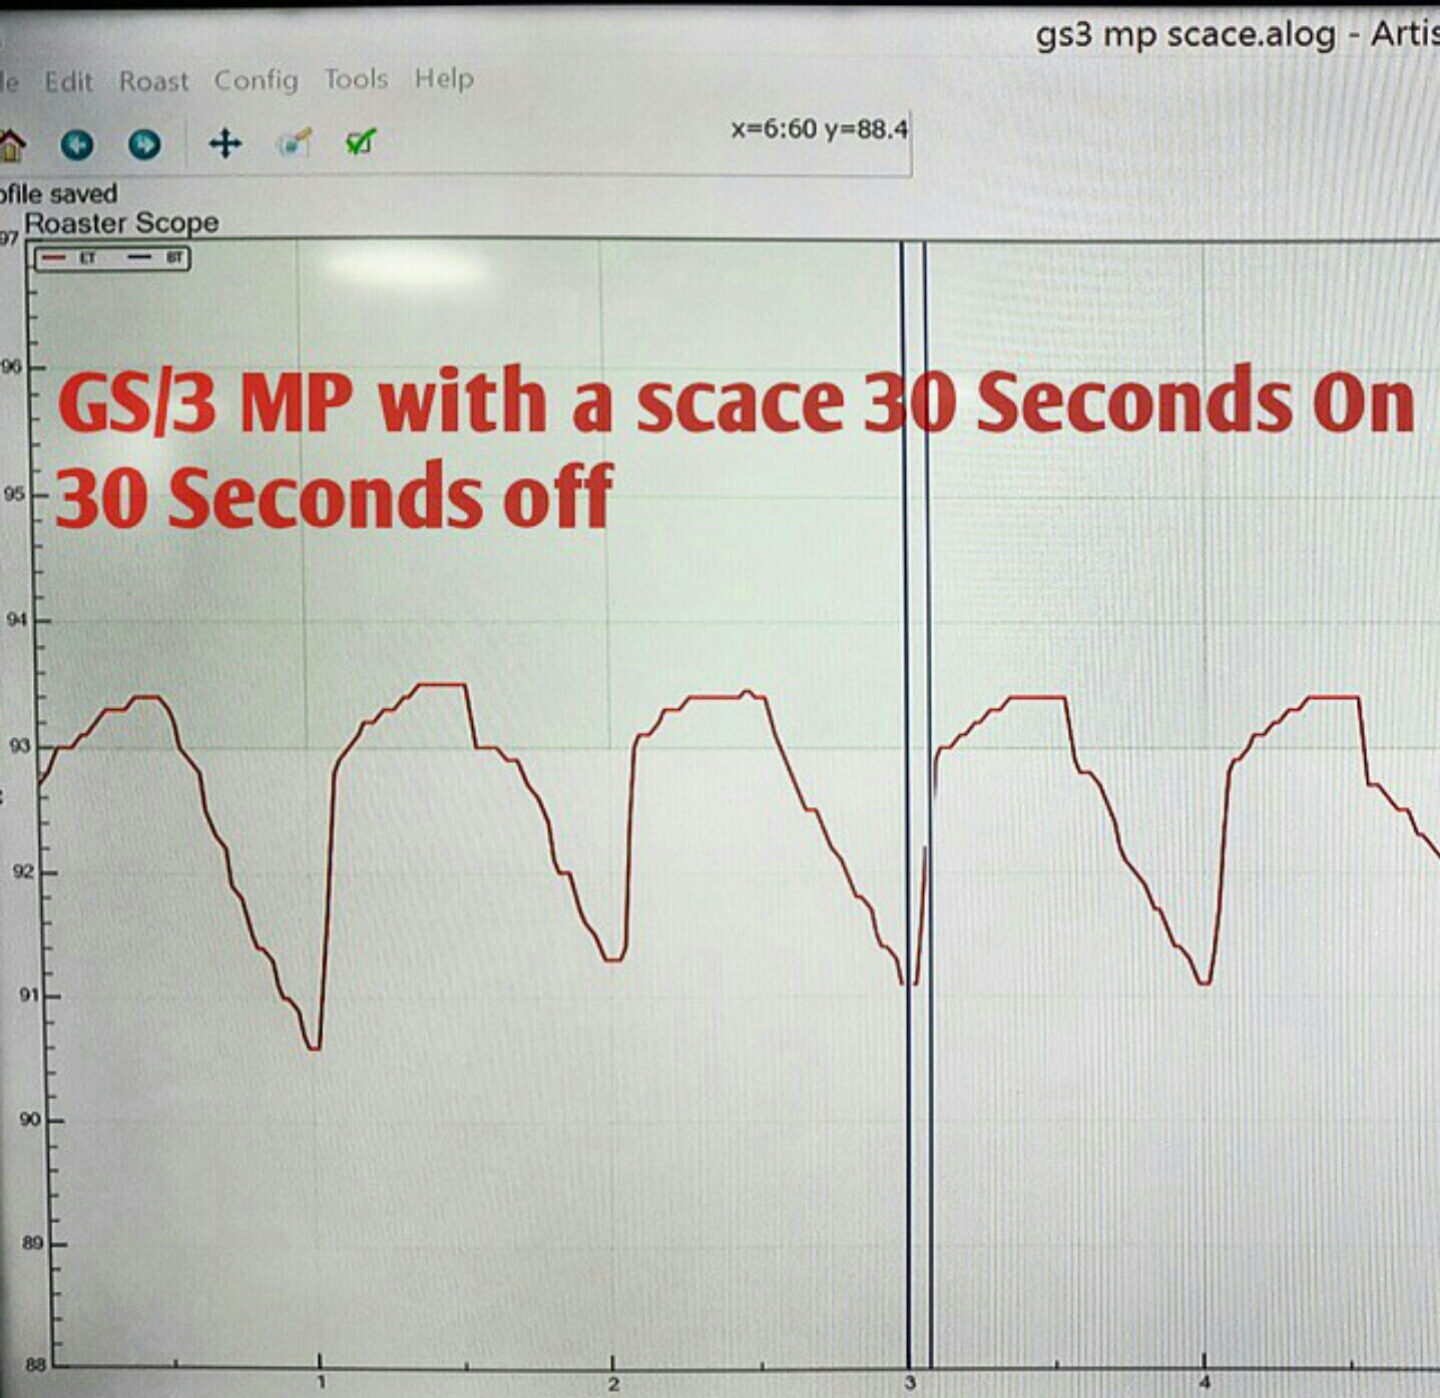
- La Marzocco (LM) GS/3 MP (mechanical paddle), single group fitted with 0.6mm restrictor and a naked portafilter with the original LM basket, set at 9 bar water pressure (verified with a Scace II); brewing temperature 92.5 degrees C regulated with a PID on board
- Water filter used for the experiment was Brita Purity C150 Quell ST
- Victoria Arduino Mythos One coffee grinder
- Two scales (Ohaus to measure the dry coffee dose; AWS to measure the beverage mass)
- Pen and paper to record values
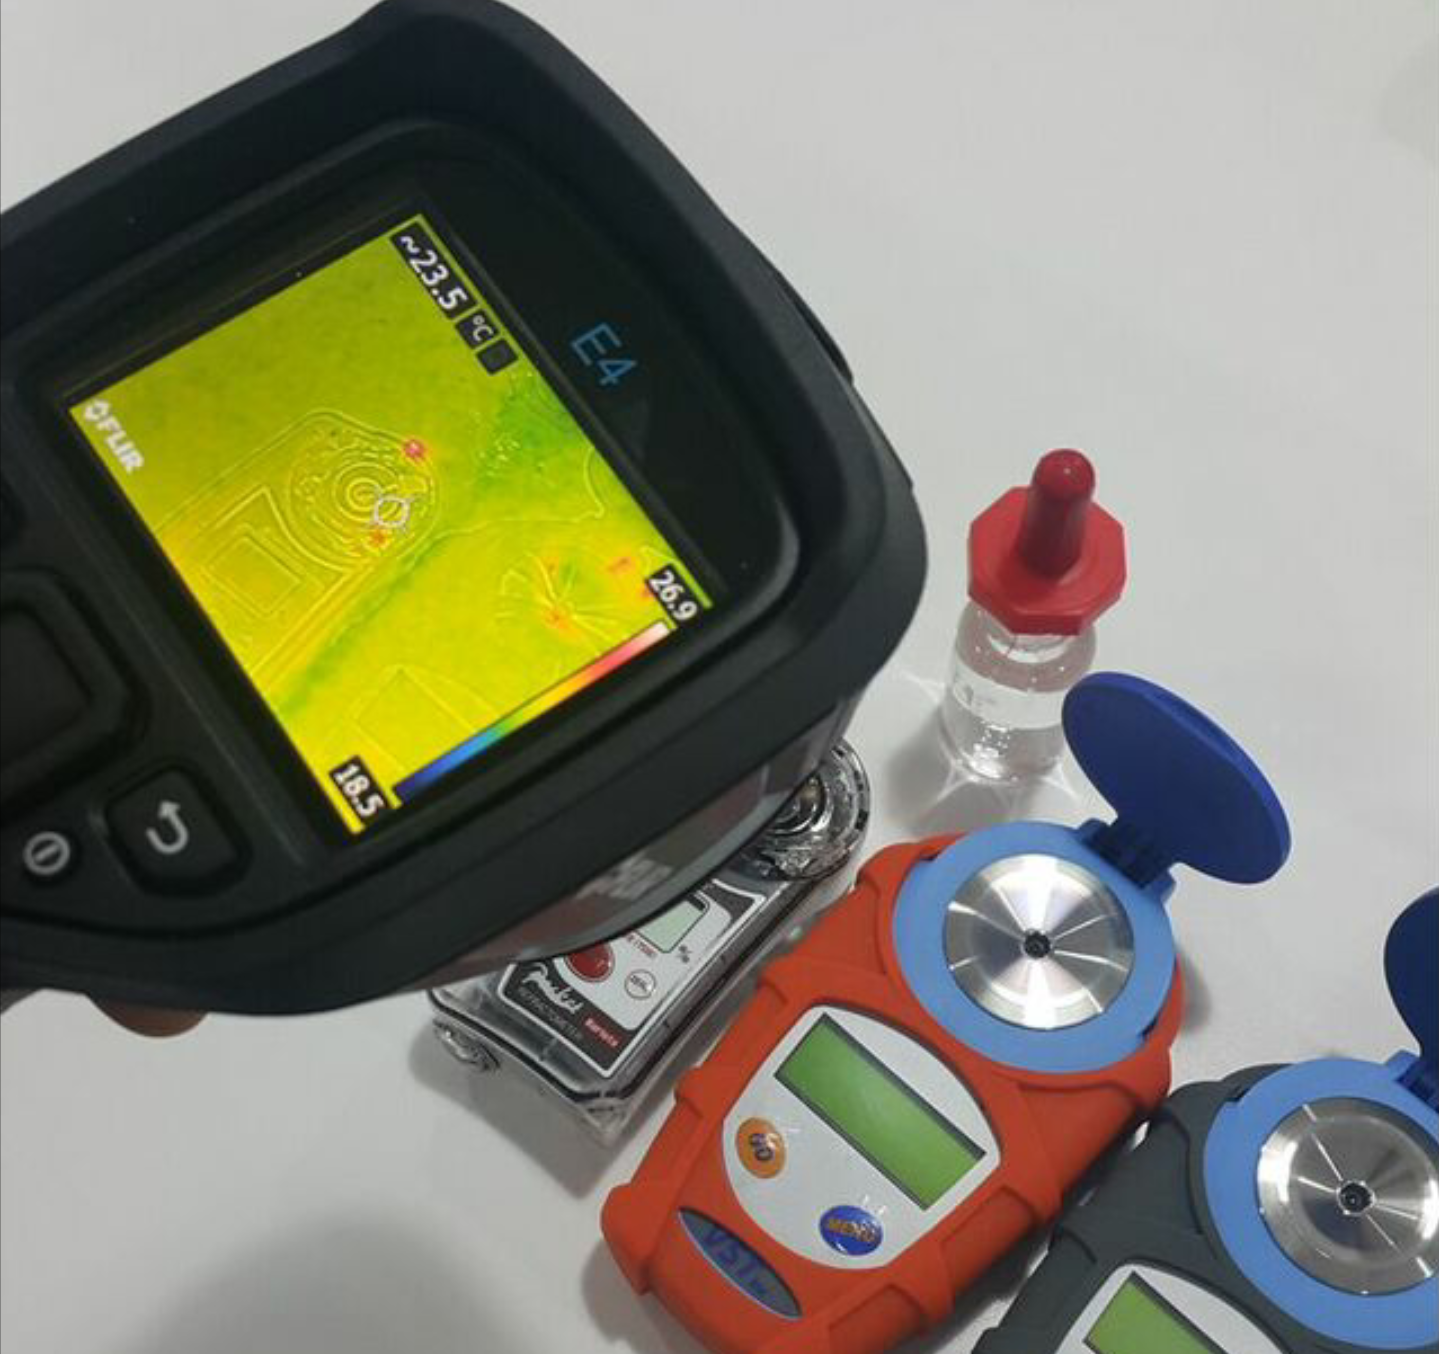
- FLIR thermal camera
- 12 (for each condition) empty ramequin bowl for measuring the mass of the shot
- 12 (for each each condition) ceramic/glass cups for TDS measurement
- Smart Tamp tamper to standardize the pressure applied to the coffee
- Atago PAL-COFFEE refractometer
- VST LAB II refractometer
- VST LAB III 4th Generation refractometer
- VST syringes
- Distilled water
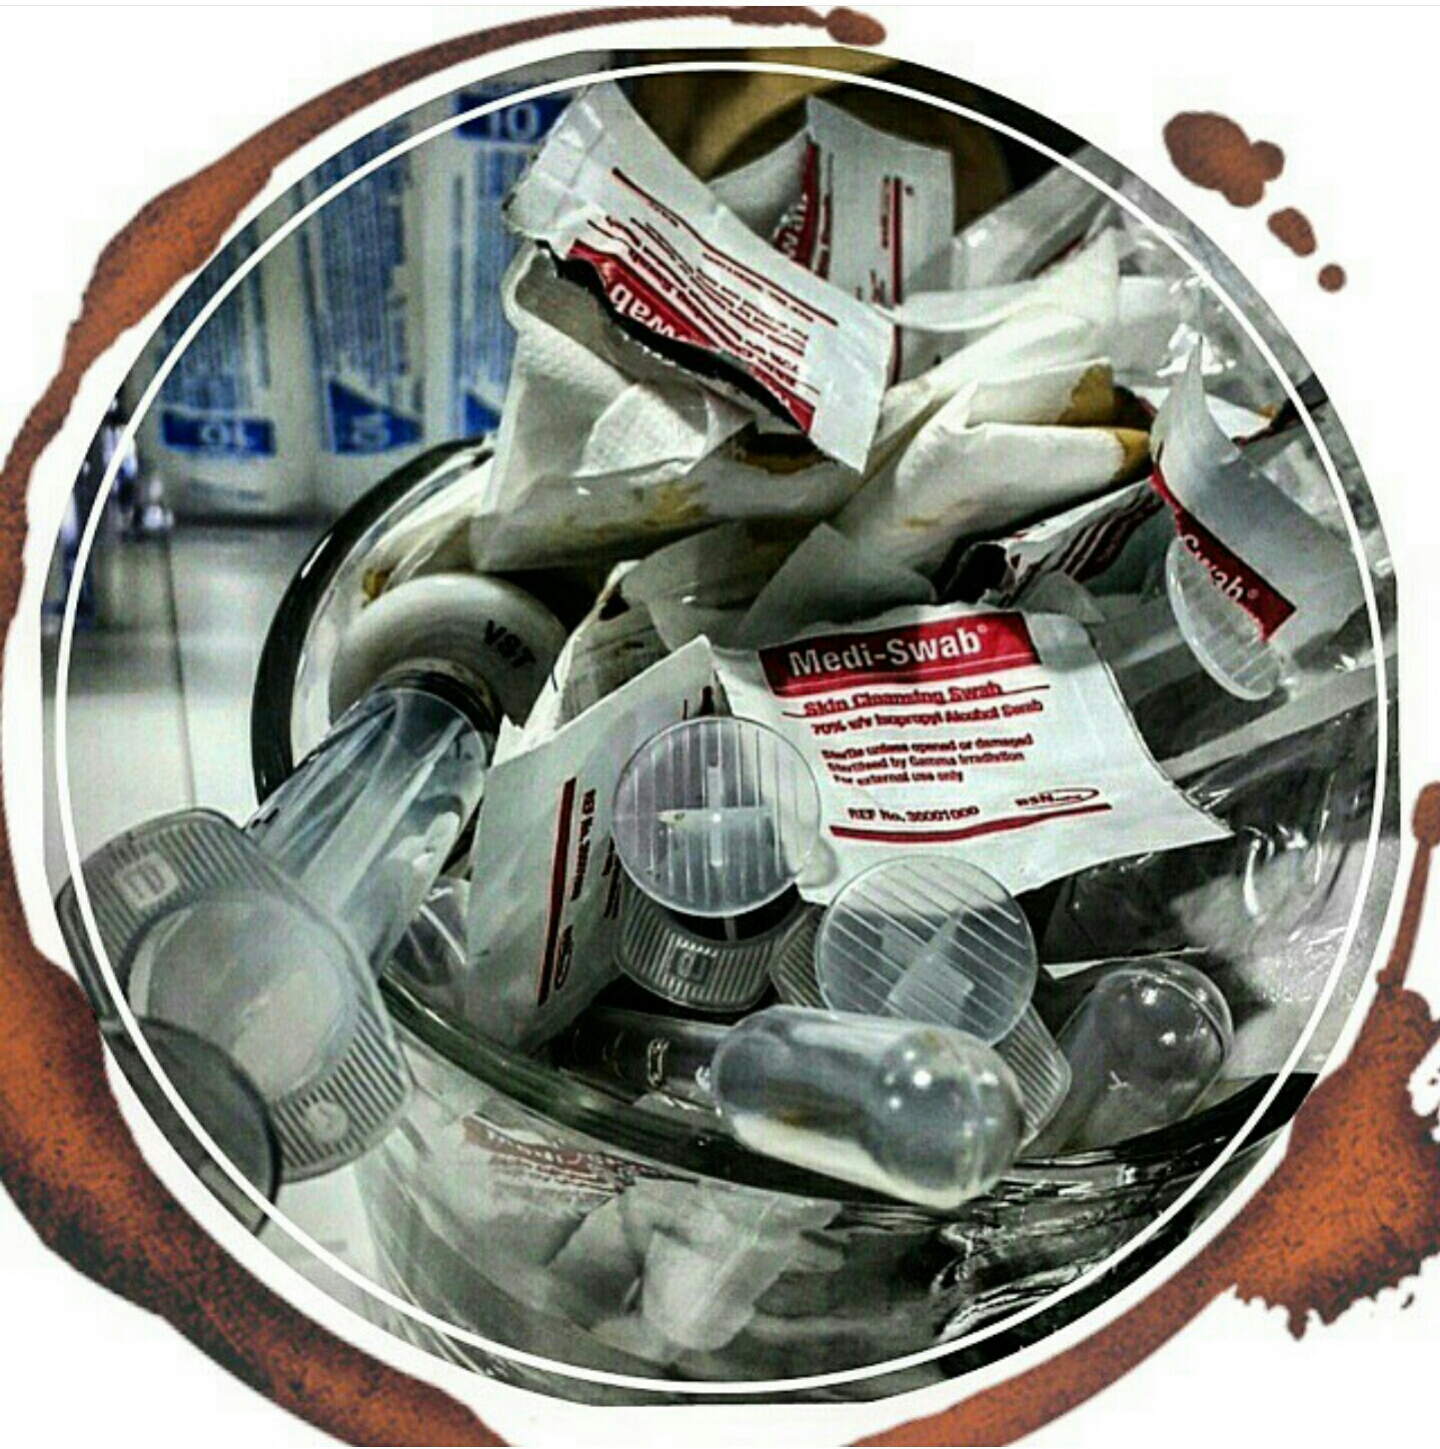
- Alcohol pads
- Pipettes
- Serviettes
Experiment was carried out over 4 hours. The conditions with the grinder, espresso machine, and coffee tamper used were kept constant for both conditions. The blades were warmed up by grinding 500g of coffee beans. The room temperature was controlled with air conditioning at approximately 23-25 degrees Celsius for the experiment.
A brew ratio of 1g coffee to 2g brew weight was used (i.e., 20g dose for 40g final beverage mass). A total of 6 shots were pulled for each condition (“Filter/No Filter”)
Zeroing preparation of the refractometers was performed identically for both conditions.
- Prior to all measurements, the refractometers were set at room temperature together with the distilled water (a common practice we use).
- All refractometers were zeroed and cleaned prior to the coffee extraction.
- The water temperature for zeroing was between 15-30°C (as recommended by VST).
Filtering procedure for all coffees was carried out according to VST instructions.
- For each shot, we allowed the espresso to cool for 1 minute and the sample was stirred for 5 seconds.
- For each espresso, 4ml of espresso was drawn up using a syringe tip (placed under the crema and without touching the bottom), followed by attaching a VST syringe filter (for one condition; no filter for the other condition) and slowly dispensing it into a clean ceramic cup. The sample was then given approximately 45 seconds to cool down.
Sampling procedure for all coffees was carried out according to VST instructions.
With a clean pipette, we drew a sample large enough to dispense in all three refractometers. This sample was transferred to a clean, dry cup and allowed to cool for an additional 30 seconds (the temperature of the sample was checked with the thermal camera). Another fresh pipette was then used to siphon the cooled espresso sample and transfer it to the refractometer wells. The coffee sample was allowed 25 seconds to equilibrate in the well of the refractometer before recording. Three total readings were taken for each sample per device, each one minute apart.
Results
A mixed design was used to analyze the data from this study (using R 3.1.1 and SPSS 19.0.0). Twelve total samples were measured. Between variables were condition (VST filter, No Filter) and device (Atago, VST LAB II, VST LAB III). Within variables were sample number (6 per condition) and reading number (3 per sample). Order of the samples being placed on the refractometers was randomised to include all possible permutations.
The three main hypotheses were 1) the Atago PAL-COFFEE, VST LAB II, and VST LAB III would give significantly different TDS readings for the same sample of coffee, 2) samples using the VST syringe filters would have significantly different TDS readings compared to the TDS readings of samples without the VST syringe filters, and 3) there would be a significant interaction between the TDS readings of the refractometers dependent on the use of the VST syringe filters.
No statistically significant effect was seen for sample order (p = 0.97). To assess the first two hypotheses, an analysis of variance (ANOVA) was run, with between-subjects variables of condition (Filter Sample, No Filter Sample) and device (Atago, VST II, VST III). No effects were found for condition (F(1,102) = 0.56, p = 0.46), device (F(2,102) = 0.06, p = 0.94), or the interaction of condition and device (F(2,102) = 0.03, p = 0.97).
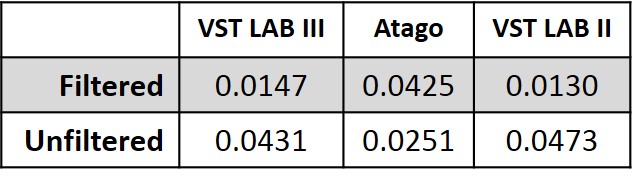
Out of curiosity, we examined the average standard deviation of multiple readings within a sample (i.e., a reading of each sample was taken every minute for three minutes with each device). This test-retest reliability (also referred to as repeatability) produced some interesting results (see Table 1). An ANOVA demonstrated a significant difference in the no filter condition (F(2,15) = 3.68, p = 0.04). Post-hoc t-tests revealed that use of a filter did impact readings for the VST devices significantly (p = 0.02 or less), but not the Atago (p = 0.30). Within a condition, t-tests revealed significant differences in the repeatability measurements only between the Atago-No Filter and VST II-No Filter (p = 0.049).
(Raw data can be downloaded in a tab delimited text file here. As always, while we offer the data for your personal use, we kindly ask that you send a message to socraticcoffee@gmail.com before posting or presenting it in any public forum and attach appropriate acknowledgement.)
Conclusions
Overall, the VST and Atago devices performed comparably. The only significant results we observed were in the test-retest reliability standard deviations, where the Atago had consistently tighter precision in its cluster of readings compared to the VST LAB II (p = 0.07 compared to the VST LAB III) in the unfiltered sample condition.
While we did not assess accuracy of the devices against a true or accepted value, there is some indication, given the lack of consistent statistical difference in their measurements, that each device is measuring comparably to the others–and this is perhaps even more so the case with the Atago and VST LAB III. Technically, our conclusion is that we fail to reject the null hypothesis–or, that we fail to reject that the espresso TDS measurements of the Atago, VST LAB II, and VST LAB III are statistically the same. Notice this is slightly different than saying the results are the same. Perhaps, for instance, given 100 samples per device, we would see regression to the true means and a statistical significance would emerge. But it is also helpful to look at findings over multiple studies. Looking at our previous posts (here and here), some significant differences between devices were noted. These differences were seen in the assessment of brewed coffee, commonly thought to require finer resolution for a device than espresso TDS assessment. Though the measurements were statistically significant, you should ask yourself whether or not the measurement differences are meaningful to you, whether or not they fall within the stated device tolerances, etc. To refer to the earlier accuracy v. precision graphic, we have been testing these devices in multiple studies with an unknown bullseye. The below figure is meant to represent a simplified generalization of our findings:
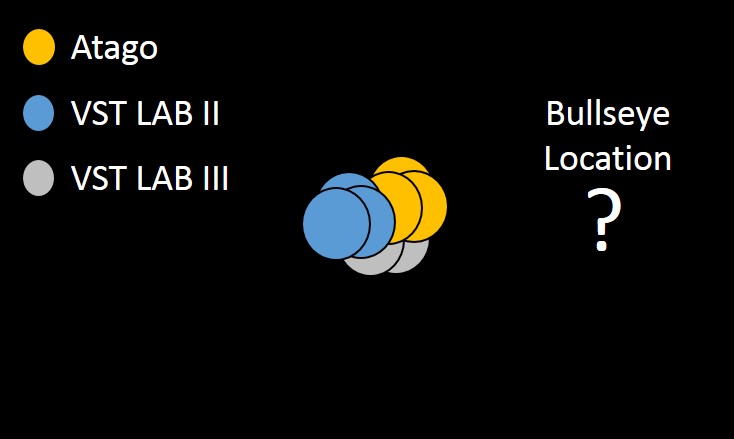
We do not necessarily know what these devices should be measuring (i.e., accuracy), but we can say that there has been little-to-no statistically significant difference in their readings. If one of these devices claims high accuracy and the measurements of other devices are not statistically different from that device, what can you conclude? If one device claims to measure things another device does not (e.g., “total dissolved solids” versus “total brew solids”), yet their measurements are not statistically different, what can you conclude? Clearly, testing of additional devices from the manufacturers would be ideal, as it is possible one or more devices we tested was an anomaly.
While many elaborate explanations could potentially explain our results, we remind you to consider Occam’s razor. There are an infinite number of possible and more complex alternative explanations; however, simpler theories and explanations, which are better tested and more falsifiable, should be preferred. This is the first open, unbiased methodical and well-controlled comparison of these devices that we are aware of. While others may claim different results, we welcome them to share their methods and data with everyone so that you, the reader, may decide for yourself.
Bottom line: Any of these devices, particularly the Atago or VST Lab III, should do an adequate job at determining the TDS of your coffee/espresso. Also, maybe reconsider whether or not you really need to filter your espresso samples.

Mark
Hi Jeremy,
There is less variability in the filtered shot’s readings for both the VSTs, +/-0.02%TDS maximum for samples 1-5, then in sample 6 the VST’s both emulate the excursions of the Atago. What would be your explanation for this? It’s not time or temperature (which are common to samples)? The outlying samples of 10.4 & 8.85 actually serve to restore the median in the statistical anaylsis (which doesn’t care about excursions in variability as long as the median is common), concealing the Atago’s higher variability in readings.
Excursions for the Atago readings vary from 0.01%TDS to 0.17%TDS. As with the “part II – brewed” test for the VST II, this could be indicative of a device outside of certification (we don’t know because we have no datum).
Atago advise users to expect a 0.5%TDS fluctuation in readings (additive to accuracy spec) for espresso.
In the unfiltered tests, the Atago’s discrepancies in readings compared to the VSTs is also obscured: in some of the samples it mirrors the VST’s decline in TDS over time, but in others it shows no change or increases significantly in TDS (sample 4 & 6). How?
Your tests confirm that, for a given sample, the Atago produces a wider range of readings, potentially outside of manufacturer’s certified specification (which requires an upcharge over the ‘off the shelf unit’) & is inconsistent in the nature of those excursions.
You say, “We do not necessarily know what these devices should be measuring (i.e., accuracy),”. Why not? Why do you still have no datums for samples “tested”? How can you come to any conclusions without such? This was the same issue in the last brewed coffee test, you have repeated the same oversight.
Mark.
Jeremy
Hi Mark,
Thanks for the comments — I hope readers of our post will read them and take your points into consideration. Cherry-picking data is not something we at Socratic Coffee support, so your points about specific pieces of data restoring the median and favoring a particular device over another fail to recognize 1) the methodology of our experiment and the inherent controls it creates (e.g., within & between comparisons) and 2) how inferential statistical analyses work. We could have done some sort of outlier removal and perhaps biased our data to fit some narrative, but we did not–the data just is what it is and we present it as such here. Open and honest. Our objective, up to this point, has not been to assess absolute accuracy but to compare relative performance of a couple of devices which claim to measure the same/similar things in coffee. But, the truth is, if you think any of the particular devices we tested is highly accurate, then you would need to concede that the others seem to be just as accurate (regardless of what the specifications state) as their results are statistically no different.
…or, as the British PM Benjamin Disraeli said, “lies, damned lies, and statistics!”
Jeremy
Soso
Wow
I love this site !
Awesome research.
And Mark, please accept the fact and don’t bias anything.
Mark
Hi Jeremy,
“Accuracy”, as we know, cannot be determined from these tests, only a degree of precision (repeatability), but even that cannot really be satisfactorily determined from 3 readings per sample, or 6 samples. Precision is a small tolerance, but this is exactly what you set out to do – measure a fine tolerance, you have published the specs you have showing precision in relation to accuracy & measurement range. When used properly the VST has demonstrably better precision (Table 1 filtered av. std deviations).
When each device is used as per manufacturer’s instructions, within sample, averaged std deviation, VST filtered & Atago non-filtered, we see a significant difference F(2,16)=62.09, p=0.00
As to how statistical analysis (ANOVA) works in detecting a significant difference, look at the ‘with filter, within sample’ test & run the VSTs against each other, despite very close std deviations, a difference F(1,10)=6.27, p=0.031 is seen due to the differing medians.
You state: “Further, when not using a filter, the Atago had consistently tighter precision in its cluster of readings compared to the VST LAB II (p = 0.07 compared to the VST LAB III)”. You have no data to illustrate any change, or lack of, in the state of the unfiltered samples over the test period (another down-side of a lack of datum & the use of separate samples for filtered & non-filtered tests). You therefore cannot draw conclusions about “precision” with regard to the non-filtered tests. Unfiltered TDS samples simply cannot be more accurate than filtered.
You state: “Sampling procedure for all coffees was carried out according to VST instructions.”, but this is not so, putting unfiltered coffee onto the prism of the VST is not in accordance with instructions.
There is no instruction, nor recommendation, to wait one minute between each reading after the sample has equilibrated, from either manufacturer. Over the course of one minute, with both instruments, you could take 10 readings from one sample, which would give a better insight into precision.
Both devices present readings in “TDS”, neither claims to measure TBS, nor NDS.
There are also a few inconsistencies in the specs you quote:
“Atago temperature range: 10-100C”, this is not the ambient temperature range as you have quoted for the VST, the ambient temperature range for the Atago is 10-40C, Atago users are instructed to use caution when measuring liquids of +50C as these can warp the housing if splashed on the device, affecting the devices waterproof specification.
Atago %TDS accuracy is +/-0.15% according to the official website.
Kind regards, Mark.
Mark
Ignore the comment regarding ANOVA on just the 2 VSTs.
Regards, Mark.
Jeremy
Hi Mark,
As always, thanks for the comments. We appreciate hearing from all perspectives. Your statistical analyses were not performed appropriately–first, a mixed model ANOVA should be run with all levels of all IVs. This omnibus test will allow you to assess potential main and interaction effects, while controlling for the familywise error rate. Doing this, you will see that a no significant results are obtained (as reported in the write-up here). At this point, it is against standard statistical procedure to proceed with more in-depth post hoc comparisons (as you stated above)–especially if comparing across devices and conditions (that was already assessed in your interaction effect). This would not be acceptable in a peer-reviewed scientific domain, so why should it be acceptable here? Our statements are based on the objective data we present. Not to mention, you reference “median” several times–inferential statistics, shown in this write-up, use mean/average as the basic calculation by which differences are determined.
It should be clear to anyone reading our work that we approach it with no preconceived notions as to how any device may or may not perform. We simply report how they do perform given the context of our design. You clearly seem to approach this with a priori notions about how a device should/will perform and desire to selectively represent and analyze the data to fit that narrative. Fortunately, we at Socratic Coffee have no bias or interest in any of these companies, but we do have years of training and expertise in how to appropriately perform and report on scientific investigations.
Best,
Jeremy
Mark
Hi Jeremy,
It is really not for you to make assumptions regarding my approach in this discussion.
My comments here are based on the specifications supplied by the respective manufacturers of the devices under discussion, the instructions for use supplied by the same, the test methodology and results achieved & published by yourselves on this blog.
Best, Mark.
Jeremy
Hi Mark —
Your approach repeatedly aims to ignore methodology/controls and appropriate analysis, instead suggesting very suspicious manipulations and interpretations of the data. For instance, how can you compare the readings from a device in the filtered condition with the readings from a different device in the non-filtered condition? That would introduce a large confound and is an inappropriate comparison based on the lack of significant main and interaction effects. Further, what is your criteria and justification for outlier identification and removal in the data? Are those systematic concerns that vary within a single condition and introduce additional confounds?
For these comparisons, we can ignore manufacturer specifications — who cares? These assessments are about how the devices perform against each other. As I’ve mentioned to you before, imagine we are given several cars from various manufacturers and are simply testing their fuel economy under the same conditions, regardless of what the manufacturers claim. The point we make here is that I can hand you a blinded data set of TDS values from these devices and you would not be able to tell from which device each set of values came. Based on our data here, in the context with which we collected them, that is objective fact. I know you mentioned the ability to do these comparisons yourself, so I look forward to seeing your own write-up.
I challenge our readers to make up their own minds.
Best,
Jeremy
Mark
Hi Jeremy,
The comparison I mention (non filtered Atago vs filtered VST) serves as an illustration, reflecting directed use, as well as to the effect of this analysis in terms of common parlance. As your audience here is not the scientific community with decades of experience in statistical analysis, but home baristas (like myself for instance), there may be subtleties in the assessment that are clear to you, but are not fully apparent to the rest of us. It is not my intention to drive you to exasperation, merely to better understand methodology & assessment in layman’s terms. You have already seen the erroneous conclusions that people can jump to when your box plot was posted on a coffee forum, prior to completion of analysis: https://instagram.com/p/3mNGVhyuJ6/?taken-by=socraticcoffee. (The min/max whiskers, interquartile ranges & outliers cover a wider range in the filtered condition because the coffee samples themselves covered a wider range of %TDS for the filtered condition, not because filtering introduced a wider variance in readings for all 3 units, as was perceived.)
So, firstly, I’d ask why such a comparison (Atago non filtered, VST filtered) is any less relevant than comparing readings from the same devices, in different conditions (filter/no filter), with different samples of coffee, over a different ranges of concentrations (%TDS)? Or, the ‘statistically no different via ANOVA’ Atago with filter vs Atago no filter, averaged SD’s reliability test (p=0.0012)?
Secondly, in terms of “precision” the smaller SD of the unfiltered Atago (0.0251 vs 0.0425 filtered) should work in its favour, being closer to the lower SDs of the filtered VSTs (0.0147 & 0.0130). However, ANOVA sees that there is statistical difference precisely because of the Atago SD being closer to the VSTs. If the Atago’s SD was over 0.0350 (lower precision) then ANOVA would detect no statistical difference.
Similarly, in the filtered condition for all devices, the Atago’s SD could be as large as you could make it once you get much past 0.0160, all the way from samples of hot, distilled water to the theoretical limit of extraction and ANOVA would still not see a statistical difference between that and the VSTs. It only sees a difference as the Atago SD gets closer to those of the VSTs. This is counter-intuative to me when reviewing & comparing “precision”.
With regard to filtered sample 6, I would be immediately suspicious (if I was running the same tests) if the SD of this sample suddenly jumped from ~0.005 to 0.046, or 0.067 relative to the average of the previous 5 tests, where the largest SD seen is 0.01 for the VSTs. I would be concerned that I may have left the samples on the prism too long and/or not closed the cover.
You also state that in the within condition, no filter, reliability test that a significant difference (p=0.049) was only observed between the VST II (mean 9.45, SD 0.0473) and the Atago (mean 9.50, SD 0.0251), but not between the Atago and the VST III (mean 9.44, SD 0.0431)? The ‘p’ value should surely be less still for a comparison of these 2 devices?
What does a t-test show for VST III (0.0147) vs VST II (0.0130) in the ‘with filter’, reliability test? As far as I can calculate it shows a difference of p=0.032. There is no difference shown between the Atago & the 2 VSTs because the larger SD (0.0425) of the Atago acts like an umbrella, over the close means, swamping the higher precision of the VSTs. This suggests to me, as a layman, that deciding by ANOVA which devices are then subject to a t-test can inadvertently obscure statistically significant results, but also that sometimes this statistical significance is questionable in a “precision” test, when the proximity of means also has an impact on the results.
In the car analogy we would put the appropriate liquids in the appropriate tanks, resevoirs & master cylinders, we wouldn’t put diesel in a petrol engine, or petrol in a diesel engine, as this would invalidate warranty (though the result would be the same for both vehicles across both conditions if we did this). If we were testing various activities, such as off-road, town driving and motorway driving we might adjust tyre pressures according to recommendations…we wouldn’t assess motorway driving fuel economy with off-road lowered tyre pressures, just as we wouldn’t assess VST precision with unfiltered coffee (as warranted spec is now out of the window).
Based on the data you provided, it is clear even from blinded samples, that there is a difference between one device & two others in filtered samples 1, 4 &5, non filtered samples 1, 3, 4 & 6. The fact that these differences are not consistent in range, nor nature of excursion, across all 6 samples is not reassuring with regards to the repeatability of the odd man out.
Both companies provide specifications for their instruments, readers can make up their own minds based on that & their determination of value for money. But, I am confused as to why different specifications (ATC range vs ambient temp range) are described as being the same thing on your blog, would that be acceptable in a peer reviewed scientific journal? I am also wondering why I am continually having to supply you with the
specifications for your Atago?
Regards, Mark.
Jeremy
Hi Mark,
Many of these things we have discussed in some manner already. In an experiment, any experiment, you have dependent variables (things you are measuring) and independent variables (things you are manipulating). All else should be controlled and constant. In this particular study, we manipulate the device (Atago, VST II, and VST III) as well as filter condition (use of a filter, no filter). Device type is called a between variable–an Atago cannot “experience” being a VST and vice-versa. Filter condition is a within variable–all devices being tested receive all levels of this variable (i.e., samples being filtered; samples not being filtered). The dependent variable (DV) for this experiment is the TDS output of the device. The beauty in this design is that the devices are tested against themselves and against each other, and this is done with filtered samples and non-filtered samples. The broad mixed model ANOVA allows us to assign the variance to treatment conditions and random error. It is important to perform it this way because the experiment was performed as such–for instance, there is statistical strength to be gained for the within-variable comparisons since variability between devices is a non-factor as each device is compared against itself in those particular calculations; also, greater variance must go in the random error term for the between comparison. Further, the larger model comparison appropriately handles the degrees of freedom and multiple comparison problems you have with running multiple one-way ANOVAs and t-tests. If no significance is found, further more nuanced comparisons are not warranted.
Stop thinking of refractometers for a moment. Imagine we have rulers from three different manufacturers. We randomly cut pieces of wood and measure each piece with each ruler. Next, we sand the edges of the pieces being measured, which one ruler manufacturer claims is necessary to get an accurate measurement. We record each ruler’s measurements again using the sanded pieces of wood. We then compare the various measurements we recorded to see if any were significantly different from the others. Comparing Manufacturer A in the “unsanded” condition against Manufacturer B in the “sanded” condition is not appropriate (unless the mixed model ANOVA demonstrated a significant interaction effect) because you are confounding the influence of “ruler manufacturer” with “sanded/not sanded”. That comparison would not be able to tell you if the difference was because of the rulers or because of the sanding. This is exactly what we’re doing here. We are assessing the TDS of coffee (i.e., lengths of the pieces of wood) using a variety of refractometer devices (i.e., rulers) with an additional variable experienced by all the devices (i.e., filtering/not filtering samples).
Your eyeballing and what-if scenarios for the data are not how an honest statistician would approach a data set and only invite bias. Another layer of protection we have at Socratic Coffee is that many aspects of the data collection and data analyses are performed in a blind fashion by separate individuals whenever possible (e.g., the experimenter is blinded by the test condition whenever practical, data is analyzed by an individual not involved in the data collection using generic labels that are matched only after analyses are completed). I am confident no other comparisons of these devices have been performed with as rigorous systematic controls as ours. Perhaps that is why the results are different than you expect.
Jeremy
Rob
Dear Mark and Jeremy,
I wish to applaud the enthusiasm you both have brought to this discussion. It’s a treat to see topics in our industry taken so seriously.
Keep it up
Jeremy
Thanks, Rob. Joe and I are happy to use our resources and expertise to help bring some objectivity to the coffee community. Our initial posts have been looking at the instruments we plan to use in future experiments (i.e., refractometers for TDS measurement). Having shown that a variety of devices are suited for the task, our hope is that others can replicate our work with whatever they may have available (e.g., variety of VST devices, Atago). We plan to explore basic questions about coffee brewing, utilizing objective metrics as much as practical/possible.
Jeremy
Mark
Hi Jeremy,
The “sanded wood” analogy simply doesn’t fit. Firstly, you would be removing measurable wood by sanding, you can’t remove TDS by filtering, because TDS is dissolved, in solution. Filtering removes solids in suspension (by universal definition, not TDS).
If your wood was covered in other matter (like a popsicle, or a shovel & handle), we would remove it to measure just the wood.
Secondly, the difference in reading (sanded/unsanded) would be more akin to a mean/accuracy/trueness (rather than remeasuring the same wood over 3 minutes), not what you are establishing here, nor TDS of the coffee. Repeatability/precision/std deviation is what you are claiming to be assessing.
The results are irrelevant with regards to my expectation, I’m not quoting anyone else’s findings or results here, just yours – but as it so happens, they are in line with expectation. Your interpretation & grasp of the subject matter are what concern me.
Regards, Mark.
Jeremy
Hi Mark,
While it may not be the world’s best analogy, the sanded wood does fit for a couple of reasons. Sanding alters the item being measured, just as filtering alters the coffee being measured. How it alters the item being measured–which particular components–is not the concern here, as our assessment approach is agnostic to that portion. We simply measure with and without the altering and then perform the statistical analyses.
Also, again, we are not seeking absolute accuracy here. In the wood piece measuring analogy, I did not say we would compare the measurements against a known standard. Only that we would compare their measurements against each other. That is the same thing we did here. If one of these devices claims greater absolute accuracy and you cannot detect a statistical difference between the readings of the three devices, what you do with that information is up to you. Some people buy cars based on things like reliability ratings and total projected cost of ownership. Others buy cars based on different criteria. If you’re buying a refractometer to measure total dissolved solids in coffee and wanting to know which device you should buy and whether or not to use syringe sample filters for your espresso and non-paper filter beverages, we have some objective, well-controlled testing data.
I appreciate your concern over my interpretation and grasp of the subject matter. Your understanding of the scientific method, experimental methodologies, and statistics are what concern me. To be honest, the experiment could be run by anyone (i.e., someone completely indifferent and unknowledgeable about coffee) following these steps, and, given these results, their conclusions would remain the same. A nuanced understanding of coffee, its dynamics in refractometry, etc. are not applicable here. I would encourage you to take our write-up to a professional chemist, as we have done, to see how our approach, analyses, and conclusions are valid. Actually, now that I think about it, find a metrologist and see what he/she thinks about this approach. We’re comparing the measurements from three different scales, the measurements from three different thermometers, the measurements from three different anemometers. It doesn’t matter. None of those require an absolute accuracy to be known to compare their readings. Data is data. Our methodology in collecting that data affords us the ability to compare the measurements. Suspended solids, dissolved solids, 0.2 micrometer filters, device manufacturer specifications, etc. are all irrelevant. Why I’m unable to communicate that to you is failure on my part and I apologize.
Best,
Jeremy
doublehelix
Again–great work!! Good to see that filtering–at least using the Atago has a salutary effect on measured TDS. Accordingly, refractive index measurements should be somewhat insensitive to suspended particles, which are not dissolved. Conceivably, filtering may introduce artifacts by removing dissolved solution components that dynamically bind to suspended particles. Interesting to see the VST instruments so sensitive to filtering, while the reproducibility of the Atago instrument actually improves with no filtering. The accuracy of the instruments remains to be established (by design of SC) and here, a simple well-defined standard (sucrose) would shed some light on this question. Coffee is a very complex fluid and simple RI measurements only begin to describe/gauge what lurks in a dissolved state, suspended, or states in between. Accordingly, such measurements should only be considered as a rough guide and one’s palate must rule in the end. This is why I like using an inexpensive optical refractometer for gauging my espressos.
doublehelix
Oops—should have written that LACK of filtering had a salutary effect, in regards to the Atago instrument…..