Posted: 28 Jul 15
Updated: 30 May 17
Abstract
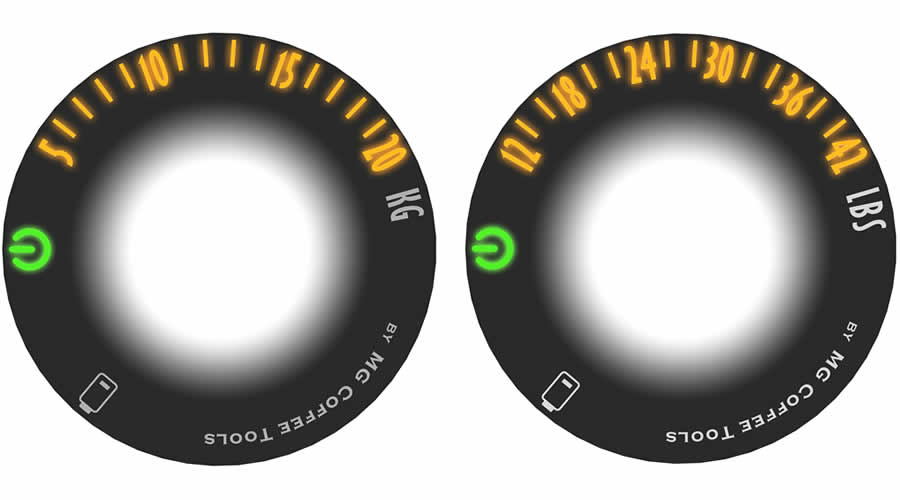
The goal of this study was to examine the impact of tamping pressure on espresso extraction. The main metric used was TDS assessed via two refractometers (VST LAB Coffee III and Atago PAL-COFFEE). Four different tamping pressures (5 kg, 10 kg, 15 kg, and 20 kg — or 12 lb, 22 lb, 32 lb, 42 lb) were assessed, with 10 shots per condition. No significant difference was found between the measurements of the VST or Atago device. Further, no significant difference in TDS (and, by extension, extraction yield) was observed due to tamping pressure. Brew weight had a significant negative correlation with TDS (p = 0.00).
Bottom line
Within the tamping pressure range we tested, no difference was seen in the TDS of the espresso. Further, no difference was observed in the readings from the Atago PAL-COFFEE and VST Lab Coffee III refractometers.
Disclosures
We have no vested interest in any of the products being used for this experiment.
Authors
Jeremy and Joe
Introduction
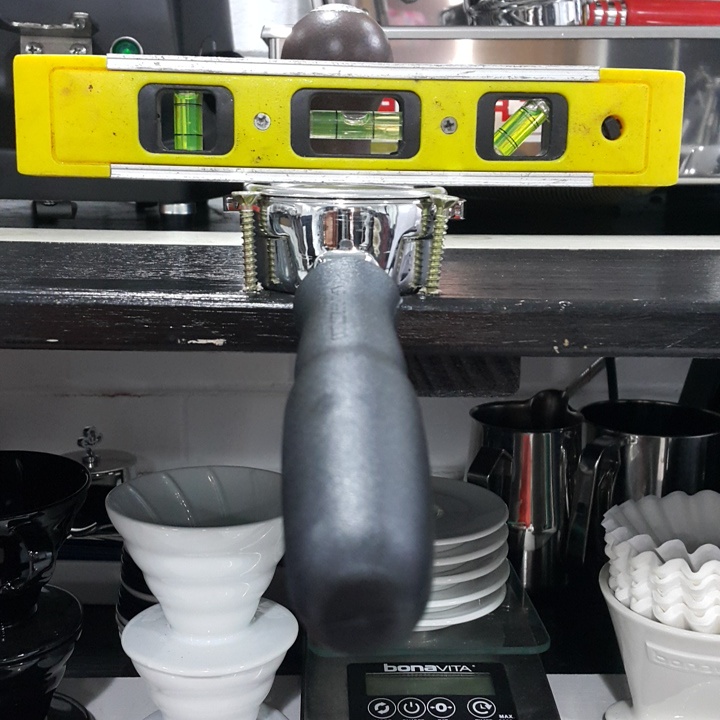
At a barista competition several years ago, a former World Barista Champion mentioned he “barely tamped” as he did not believe tamping pressure played a significant role in an espresso’s extraction. This planted a seed for an idea we’ve been wanting to test in a controlled, systematic way for many years now. Further, before we move forward with other assessments relating to tamping, we decided to better understand the impact of some basic variables. With a setup capable of ensuring a completely level tamp, we set out to test the influence of tamping pressure on extraction.
The two main hypotheses were 1) tamping pressure would have a significant effect on TDS and 2) the Atago PAL-COFFEE and VST LAB III would give significantly different TDS readings for the same sample of coffee. Neither of these were supported by our data.
Methods
The coffee used for the experiment was MC Euro Classic Espresso Blend. Coffee was rested for 11 days before use. The same batch of roasted coffee was used for the entire experiment.
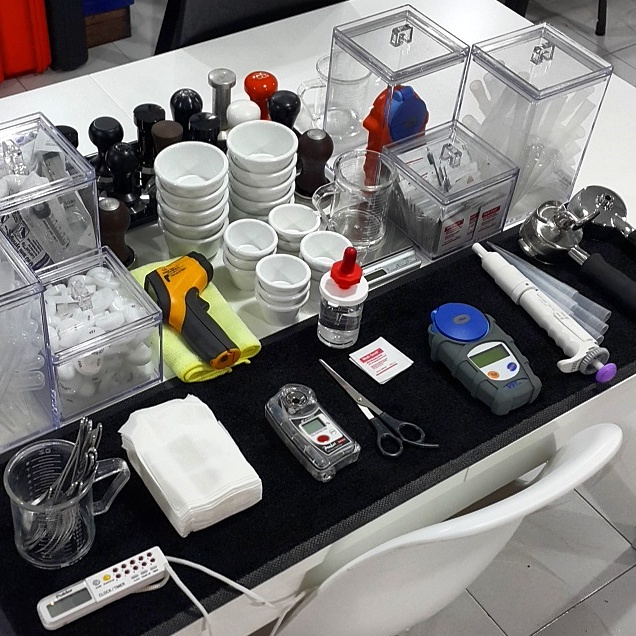
Equipment used:
- La Marzocco (LM) GS/3 MP (mechanical paddle), single group fitted with 0.6mm restrictor and a naked portafilter with the 20g VST basket filter, set at 9 bar water pressure (verified with a Scace II); brewing temperature 92.5 degrees C regulated with a PID on board
- Water filter used for the experiment was Brita Purity C150 Quell ST
- Victoria Arduino Mythos One coffee grinder
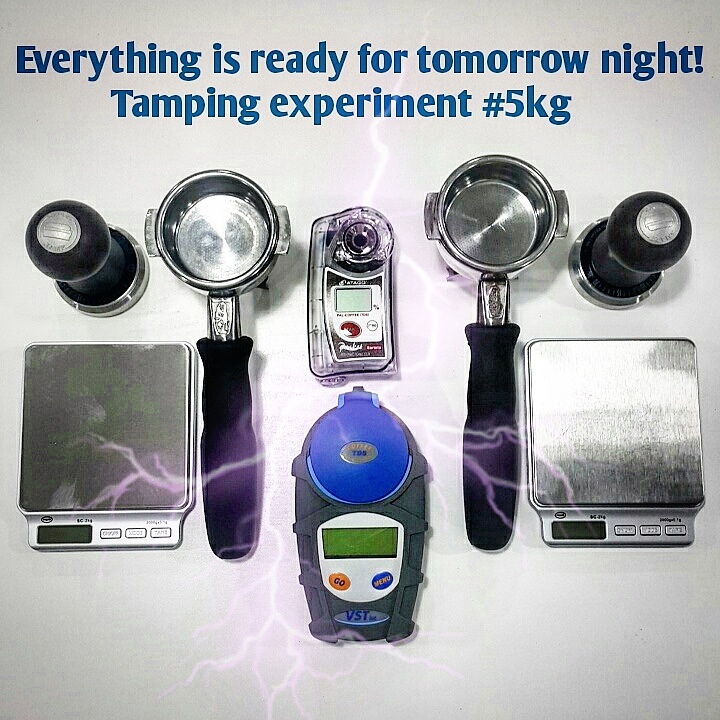
- Two scales (Ohaus to measure the dry coffee dose; AWS to measure the beverage mass)
- Pen and paper to record values
- Pair of scissors
- Infra red thermometer
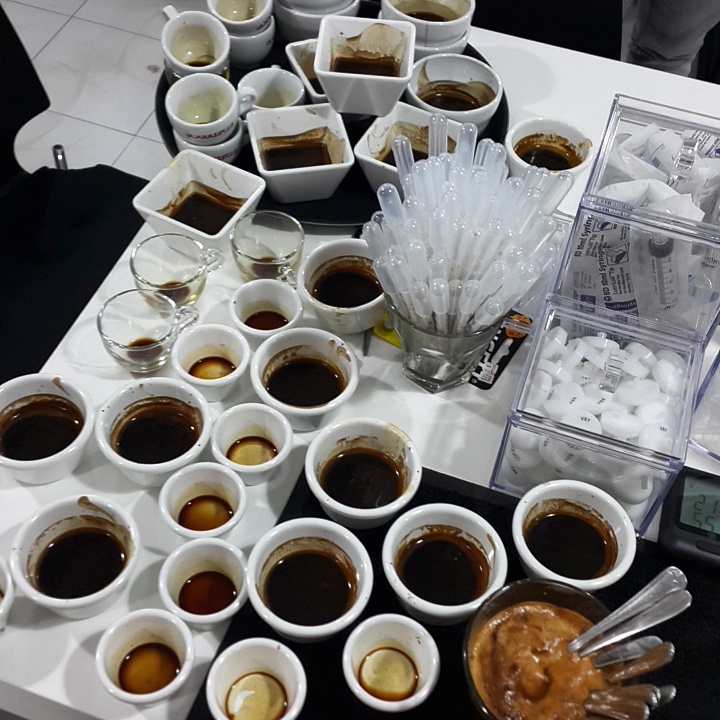
- 10 (for each condition) empty ramequin bowl for measuring the mass of the shot
- 10 (for each each condition) ceramic/glass cups for TDS measurement
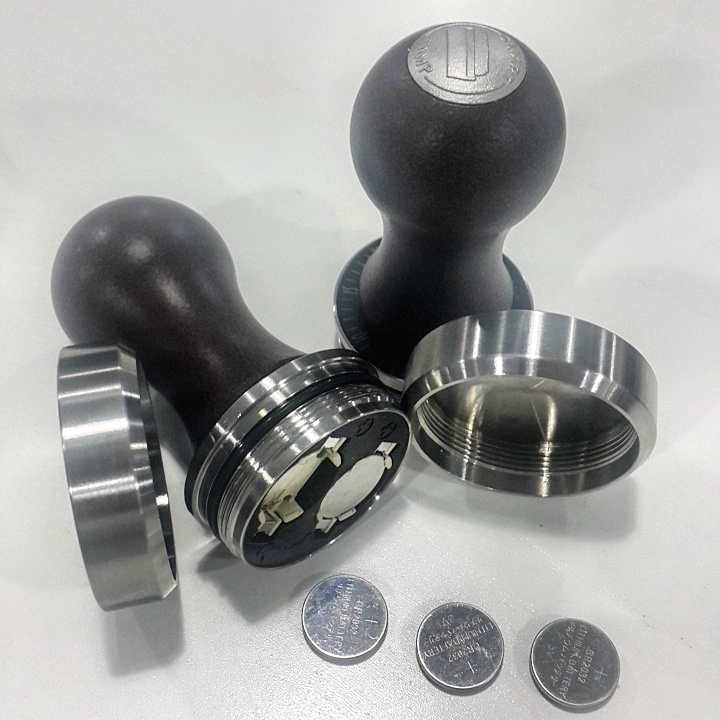
- 2 X Smart Tamp tamper to standardize the pressure applied to the coffee (accuracy verified with a scale)
- Atago PAL-COFFEE refractometer
- VST LAB III 4th Generation refractometer
- Distilled water
- Alcohol pads
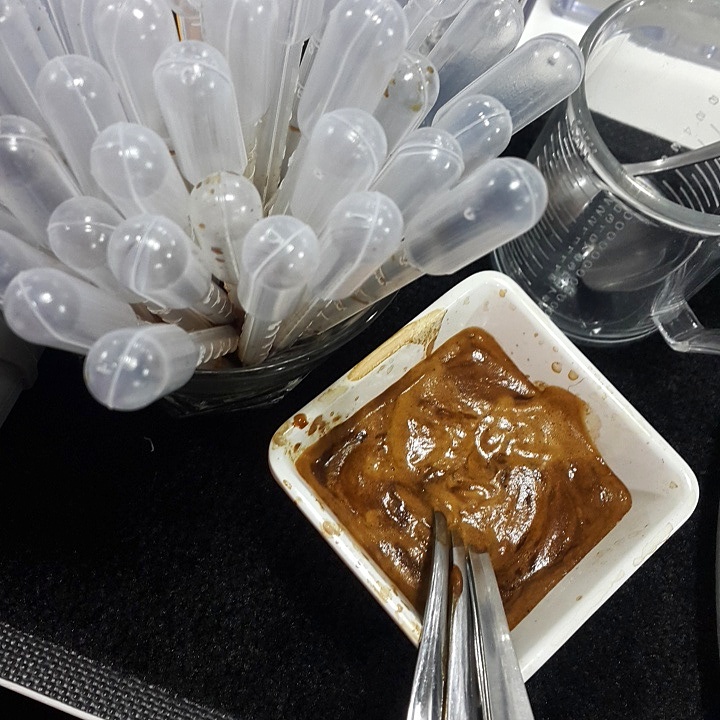
- PipetteServiettes
Experiment was carried out over 5 hours. The conditions with the grinder and espresso machine were constant for all conditions. The grinder blades were warmed up by grinding 500g of coffee beans. The room temperature was controlled with air conditioning at approximately 19-21 degrees Celsius for the duration of the experiment.
A brew ratio of 1g coffee to 2g brew weight was used (i.e., 20g dose for 40g final beverage mass). Because TDS is most strongly correlated with quantity of beverage, shots were all pulled to a consistent weight. Time to reach this weight was recorded, giving us a metric of flow rate (weight/time). The grinder was dialed in using 15 kg tamping pressure with a target of 40g final beverage mass in around 40 seconds. No grind adjustments were made for the entirety of the experiment.
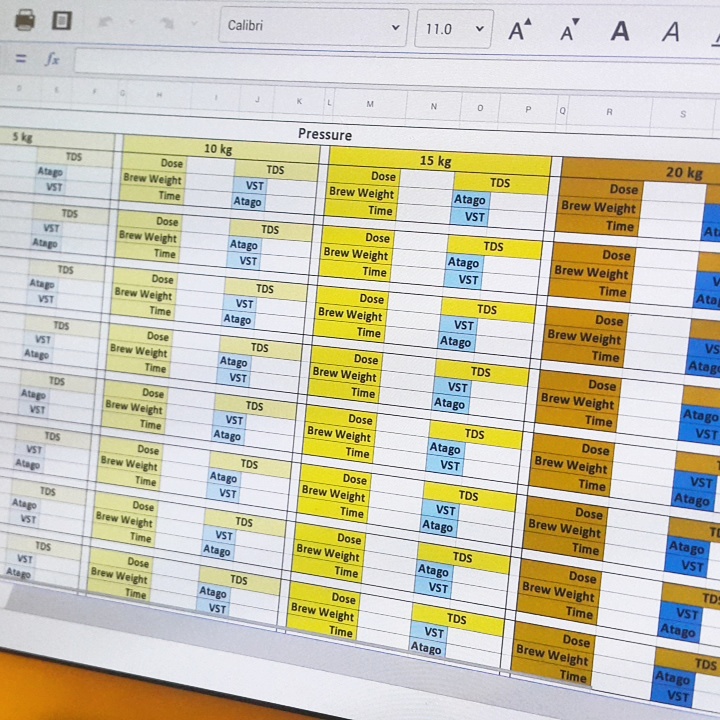
Four different tamping pressures (5kg, 10kg, 15kg, and 20kg) were applied with a 58mm diameter tamper base, with 10 shots per condition.
Zeroing preparation of the refractometers was performed identically for all conditions.
- Prior to all measurements, the refractometers were set at room temperature together with the distilled water (a common practice we use).
- All refractometers were zeroed and cleaned prior to the coffee extraction.
- The water temperature for zeroing was between 15-30°C (as recommended by VST).
Filtering procedure for all coffees was carried out according to VST instructions.
- For each shot, we allowed the espresso to cool for 1 minute and the sample was stirred for 5 seconds.
- For each shot, the coffee crema was skimmed with a clean spoon prior to every reading
- For each espresso, 4ml of espresso was drawn up using a pipette and slowly dispensing it into a clean ceramic cup. The sample was then given approximately 45 seconds to cool down. Filters were not used for this experiment, as our other experiment demonstrated that they do not have a significant effect on the devices’ TDS readings for espresso.
Sampling procedure for all coffees was carried out according to VST instructions.
With a clean pipette, we drew a sample large enough to dispense into both refractometers. This sample was transferred to a clean, dry cup and allowed to cool for an additional 30 seconds (the temperature of the sample was checked with the infra-red thermometer). Another fresh pipette was then used to siphon the cooled espresso sample and transfer it to the refractometer wells. The coffee sample was allowed 25 seconds to equilibrate in the well of the refractometer before recording.
Results
A mixed design analysis approach was used on the data from this study (using R 3.1.1). As per our usual protocols, data was analyzed in a de-identified manner (using labels matched to a key after all analyses were completed) by an individual not involved in the data collection. Ten samples per pressure condition were measured (40 total measurements for each refractometer). The between variable was device (Atago, VST Lab III) and the within variable was pressure (5 kg, 10 kg, 15 kg, 20 kg). Order of the samples being placed on the refractometers was pseudo-randomised to ensure a balanced order at each pressure level.
Data was first assessed to ensure it does not violate assumptions for an analysis of variance (ANOVA) or multiple linear regression analysis. A mixed model ANOVA was then performed, yielding no significant difference between the Atago and VST measurements (p = 0.70), no significant difference between pressure conditions (p = 0.40), and no significant interaction between device and pressure condition (p = 0.70). Extraction yield, of which several methods exist to calculate, was then used in place of TDS. As expected, no significant differences were seen between device, pressure condition, or the interaction between the two (all p = 0.60+ regardless of which formula was used). Because there were no statistical differences, TDS measurements from both devices were collapsed into a single variable for further analyses (unless otherwise specified).
Brew times to reach the goal weight (40g) were not significantly affected by tamping pressure (p = 0.30), but the impact of brew weight and brew time was significant on final TDS. Because of their significant correlation with each other (p = 0.00), before being entered into the regression model, the brew weight and time variables were centered (i.e., [value – mean]) as is standard (e.g., Draper & Smith, 1998). This allowed them to be entered into the multilevel model. The four-level model included the variables of pressure, device type, brew weight (centered), and brew time (centered). Results yielded an overall significant model (F4,75 = 4.181, p = 0.00) with an adjusted R2 of 0.1823. Of the predictor variables, the only significant predictor was that of brew weight (p = 0.00).
Lastly, extraction yield was, not surprisingly, significantly correlated with TDS. Though the extraction yield calculations differed significantly from one another, which extraction yield formula you use is somewhat irrelevant, as they yield differing results not due to quantities measured here but in the incorporation and/or handling of various assumptions/other variables (e.g., CO2).
(Raw data can be downloaded in a tab delimited text file here. As always, while we offer the data for your personal use, we kindly ask that you send a message to socraticcoffee@gmail.com before posting or presenting it in any public forum and attach appropriate acknowledgement.)
Conclusions
Overall, the VST and Atago devices performed comparably–the readings from the different devices are statistically indistinguishable. Tamping pressure, in the given range we assessed (5-20 kg), yielded no significant impact on TDS nor did it significantly impact the extraction itself (i.e., time to reach beverage weight). Our statistical model explained 18.23% of the variance in the TDS samples measured. It is clear that brew weight was, by far, the most important factor in determining the TDS of the espresso (and the only significant one). Below are the relative contributions of each variable to that explained variance:
It is possible that tamping pressure outside of the range we assessed significantly impacts espresso extraction. Additionally, it may be that other variables not quantified here were significantly affected. Our measurements captured the total dissolved solids content of the shot, as well as a rate metric (brew weight/total brew time), but it is possible that tamping pressure affects aspects of the extraction that we did not assess (e.g., characteristics of particular compound extraction such as lipids).
Davide
I agree with your study, but i think the important is cupping the samples, it’s true that they can achieve same TDS but is also important to understand wich coumpound are in, sugars can be replaced by fats, o acids coumpounds by quinics.. give same results on TDS% and Extraction yeld, but significantly have different taste..
But is courious to see that 5kg tamping is enought to leveling a compact the cake, enought to prevent channeling, that’s really interesting..
Thanks to share this test.
Joe
Hi Davide,
Thanks for the comment. I think you’re right on. This is something we have been discussing ourselves (and we mention in the conclusion). TDS is simply a measure of “how much stuff” the solution contains. At the end of the day, ideally, we also want to couple that with “what are the constituents of the stuff”? The reason we have stayed away from tasting samples is that it becomes very subjective and difficult to quantify. Even though we have many years of experience in coffee, we recognise that humans are simply bad at subjective assessments (e.g., look at all the work in the wine world by Robert Hodgson). Ideally, we’d have some sort of chromatography system to give a breakdown on the quantity of individual components.
Joe